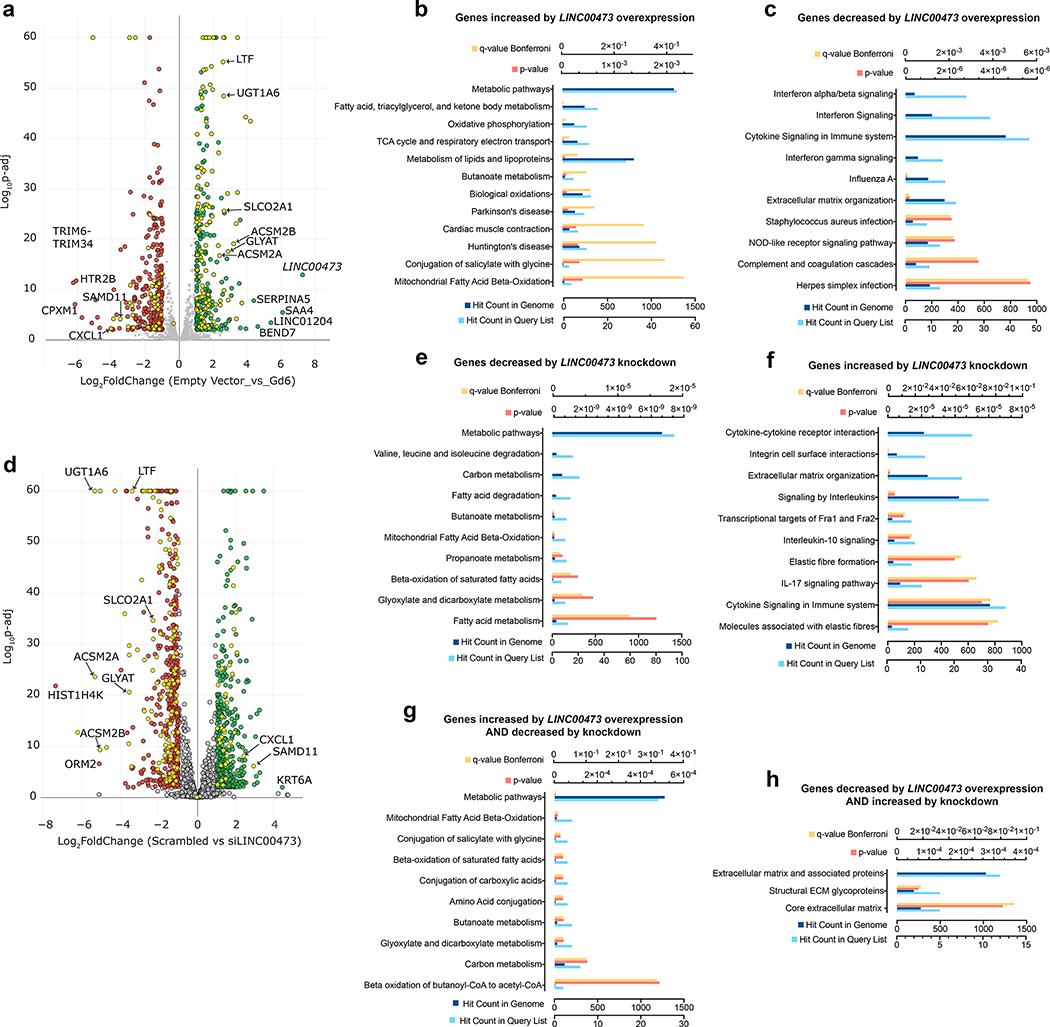
Figure 6. Transcriptomic changes in response to modulation of LINC00473.
a. Volcano plot of genes differentially expressed in cells overexpressing LINC00473 through the CRISPR-SAM guide 6 (Gd6). RNASeq data obtained from n=4 (empty vector) and n=3 (Gd6) independent cell cultures was compared. b. Pathways enriched in genes that were increased in Gd6 cells compared to empty vector. c. Pathways enriched in genes that were decreased in Gd6 cells compared to empty vector. d. Volcano plot of genes differentially expressed in Gd6 cells transfected with scrambled compared to directed (siLINC00473) pools of siRNA oligonucleotides. RNASeq data obtained from n=4 (Scrambled) and n=4 (siLINC00473) independent cell cultures was compared. e. Pathways enriched in genes that were decreased by LINC00473 siRNA. f. Pathways enriched in genes that were increased by LINC00473 siRNA. Yellow symbols in (a) and (d) depict genes that were reciprocally regulated by overexpression and depletion of LINC00473. g. Pathways enriched in genes that were increased in cells overexpressing LINC00473 AND decreased in cells where LINC00473 was knocked down. h. Pathways enriched in genes that were decreased in cells where LINC00473 was overexpressed AND decreased in cells where LINC00473 was knocked down.

