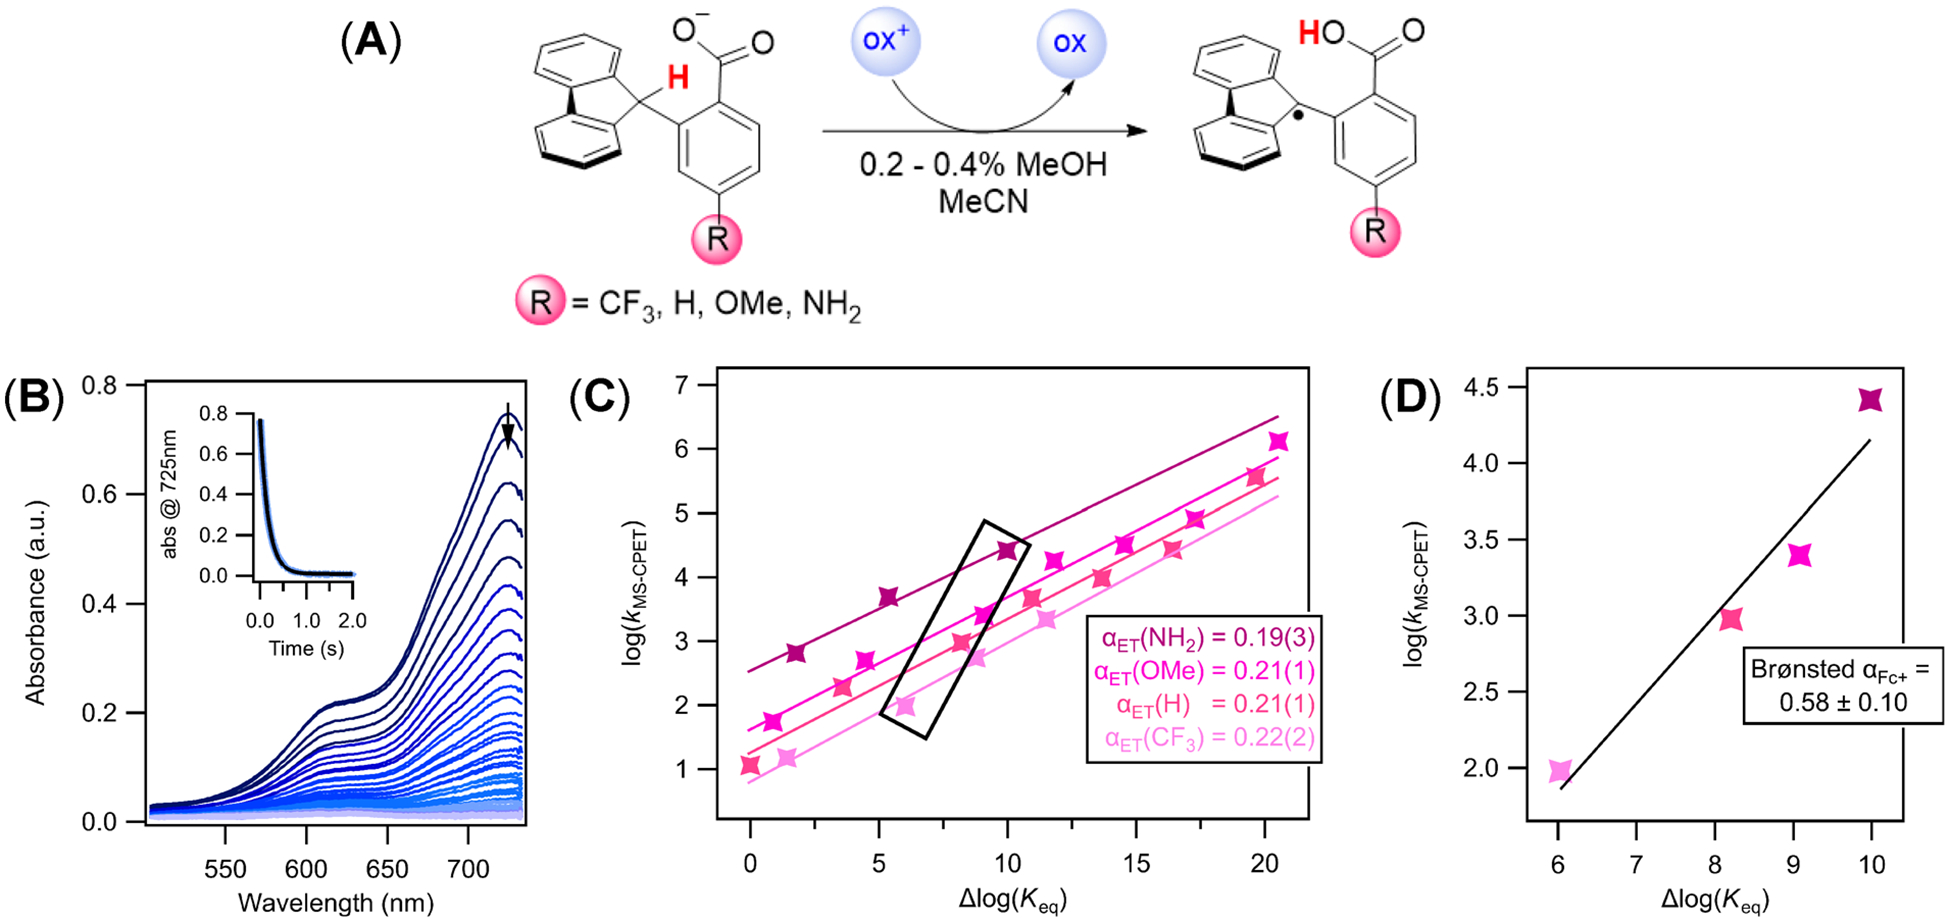
Figure 1.

(A) General reaction scheme for the oxidation of Flr(R)CO2− substrates. Reactions were performed with an excess of carboxylate, generated in situ with TBAOH (as a solution in MeOH). Absorbance spectra were monitored on a stopped-flow following the disappearance of the colored aminium and ferrocenium oxidants. (B) Representative absorbance versus time data set monitoring the reaction of N(ArOMe)3•+ with Flr(OMe)CO2−. The inset shows the absorbance at the λmax of the oxidant, 752 nm, versus time, and the fit to an exponential function using SpecFit global fitting software. (C) Plot of the logarithm of the MS-CPET rate constants (kMS‑CPET = k2/2) versus changes in driving force for all substrates over a range of oxidants. Δlog(Keq) = −ΔΔG°rxn/2.303RT and ΔΔG°rxn = ΔBDFECH(CO2H) − 1.37ΔpKa(CO2H) − 23.06Eox (see text and Scheme 2). The Δlog(Keq) for the reaction of the R = H compound with FeCp*2+ has been set equal to zero,12 and all other values are relative to that based on changes in BDFECH and pKa,COOH (see the Supporting Information for all values). Uncertainty in the last decimal is shown in parentheses. (D) Plot of MS-CPET rate constants versus changes in driving force for the four substrates with a single oxidant (FeCp2+).
