
Figure 22.
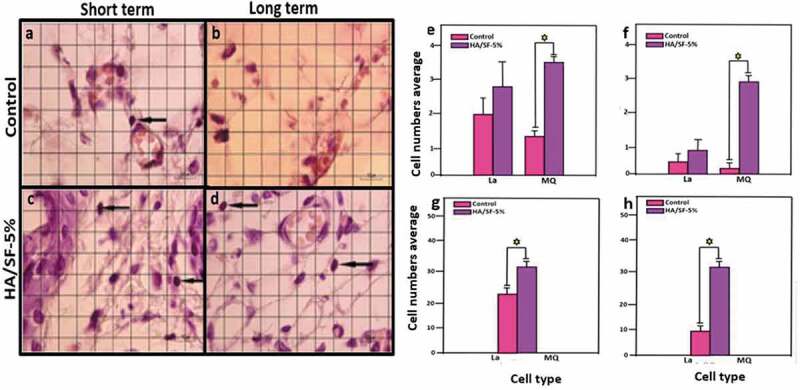
(a–d) In vivo biocompatibility of HA/SF-5% (black arrows denote lymphocytes, eosin and haematoxylin staining). (e–h) Increment of lymphocytes at the implantation site between control and experimental groups [187]
Official websites use .gov
A
.gov website belongs to an official
government organization in the United States.
Secure .gov websites use HTTPS
A lock (
) or https:// means you've safely
connected to the .gov website. Share sensitive
information only on official, secure websites.
(a–d) In vivo biocompatibility of HA/SF-5% (black arrows denote lymphocytes, eosin and haematoxylin staining). (e–h) Increment of lymphocytes at the implantation site between control and experimental groups [187]