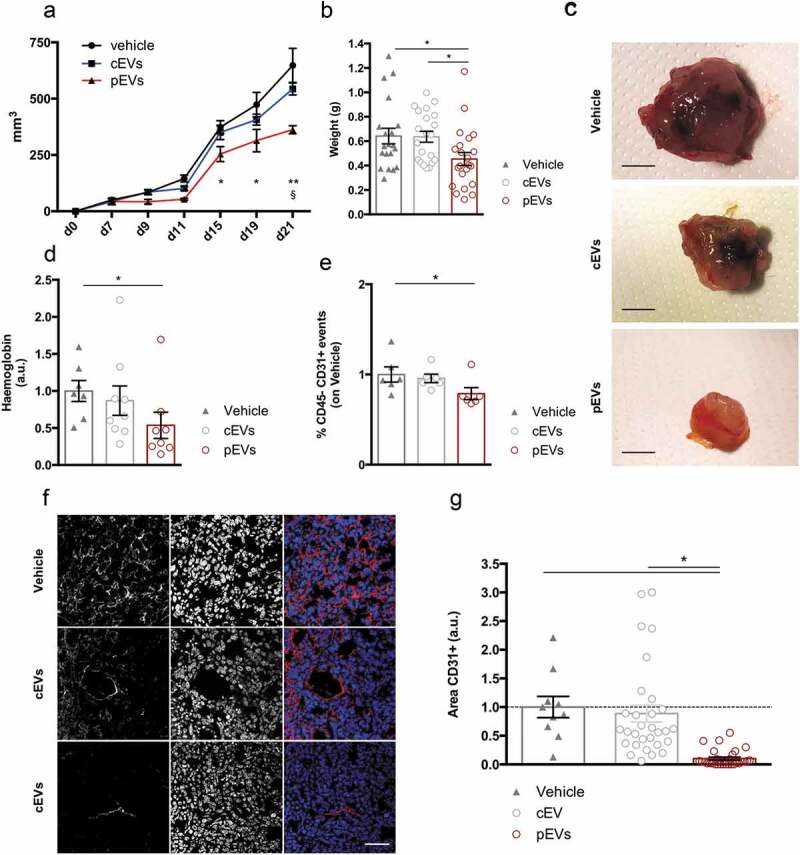
Figure 7.

pEVs control pathological tumour-associated angiogenesis. . E0771 tumor cells were subcutaneously injected in 7-weeks old female mice. (a) The mass growth was measured. 2 way ANOVA; *P < 0.05 between PBS and pEVs. $P < 0.05 between cEVs and pEVs. (b, c) At the day of the sacrifice, tumours were pictured and weighted. The vascularization of the tumors was quantified by the analysis of the haemoglobin content, trough the Drabkin’s reagent kit 525 (Sigma-Aldrich (d), and by the calculating the percentage of endothelial cells by flow cytometry (e). Data are expressed as means ± SEM (at least 6 mice/group). Kruskal–Wallis test with Dunn’s multiple comparisons test; *P < 0.05. (f, g) Tumor cryosections were stained for CD31 (red). The positive areas were calculated with ImageJ and normalized on the vehicle. Scale bar 75 μm. Data are expressed as means ± SEM (5 mice/group). Kruskal–Wallis test with Dunn’s multiple comparisons test; *P < 0.05.
