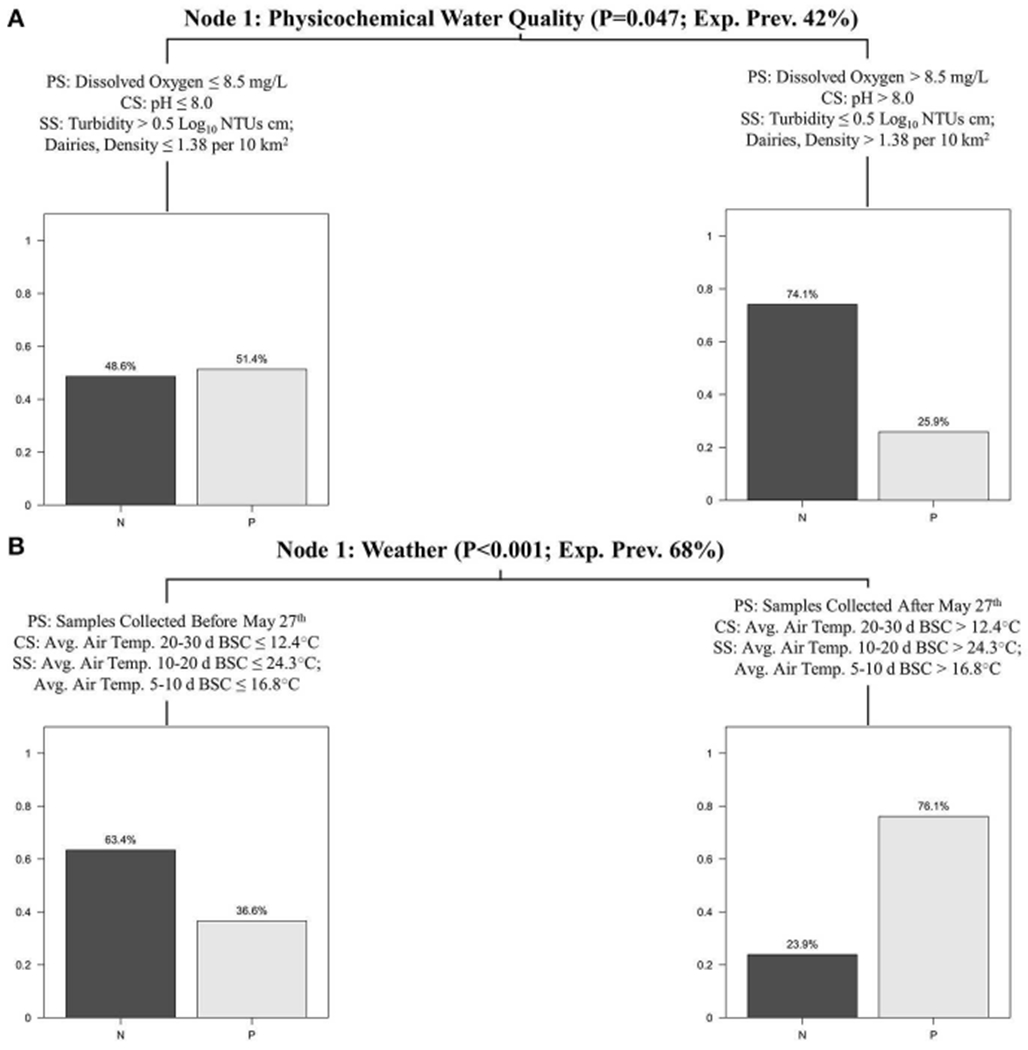
FIGURE 2 |.

Salmonella (A), and eaeA-stx (B) CTrees showing the primary split (PS), competitor split (CS), and two surrogate splits (SS) for each node. The splits that comprise each node are generalized in the node description (e.g., most splits in node 1A are physicochemical water quality factors). The p-value is the p-value associated with the primary split for the given node. The expected prevalence in Node 1 was the prevalence of the given microbial target in the study reported here. Bar plots show the exp. prevalence of samples that were negative (N) or positive (P) for the given target(s) in each terminal node.
