
FIGURE 3 |.
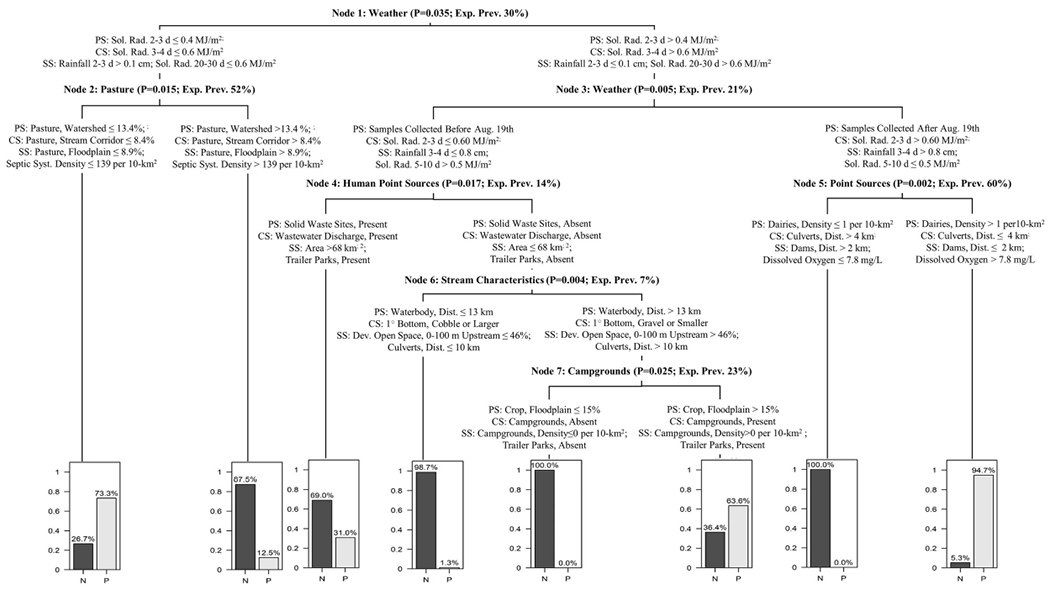
L. monocytogenes CTree showing the primary split (PS), competitor split (CS), and two surrogate splits (SS) for each node. The splits that comprise each node are generalized in the node description (e.g., all splits in node 1 are weather factors). Each node description also includes the P-value associated with the node’s primary splits, and the expected L. monocytogenes prevalence (exp. prev.) based on the node’s parent splits [e.g., exp. prev. in Node 2 for samples collected when avg. solar radiation (sol. rad) 2–3 d BSC was < 0.4 MJ/m2 was 52%]. The expected prevalence in Node 1 is greater than that reported in Table 1 since upsampling was used to address the imbalanced nature of the L. monocytogenes data when performing CTree analysis. Bar plots show the exp. prevalence of L. monocytogenes negative (N) and positive (P) samples in each terminal node. For example, the expected prevalence of L. monocytogenes in samples collected on a day when sol. rad 3-4 d BSC was ≤ 0.4 MJ/m2 and pasture accounted for > 13.4% of the upstream area was 12.5%.