Figure 7.

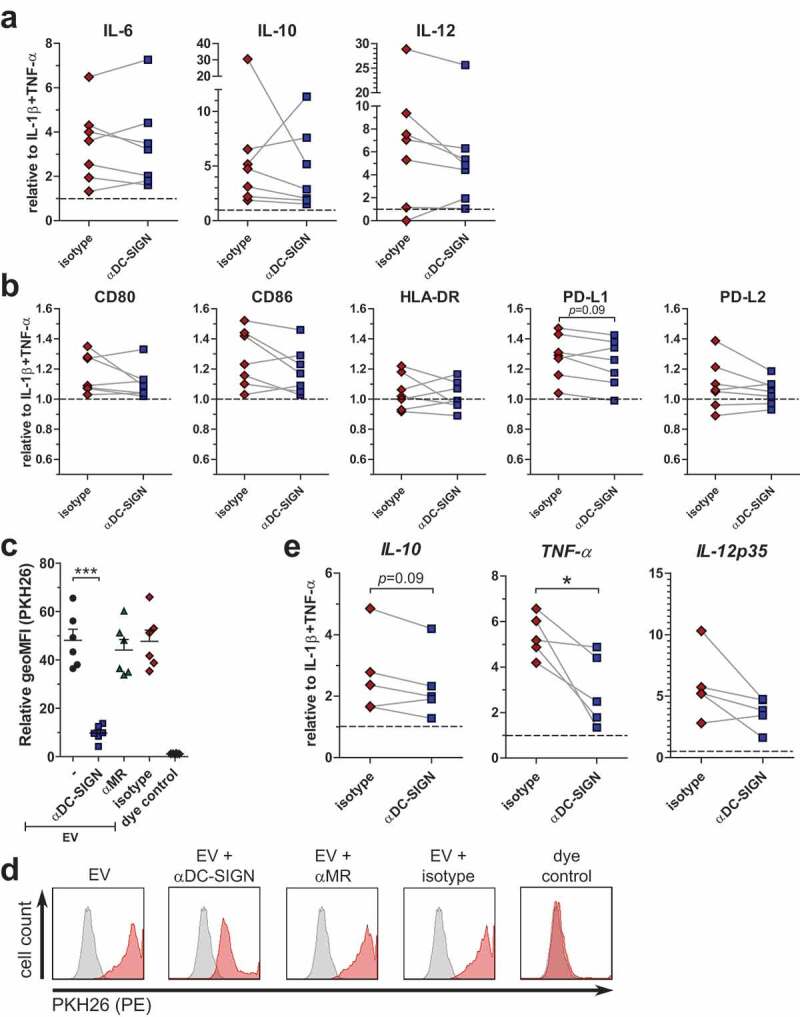
Role for DC-SIGN in augmented immune responses by schistosomula EVs.
Released cytokines (a) and surface marker expression (b) of moDC with indicated pre-incubations (x-axes) before EV incubation. Linked points represent data from one donor. Data is shown as fold change relative to moDC with IL-1β and TNF-α from that specific donor (n = 7). Summary of geometric mean fluorescent intensity (geoMFI) of moDC incubated with PKH26-labelled EVs for 48 h, relative to medium control (c) (n = 6). Histograms of moDC from one representative donor from data plotted in c (d). Relative expression of mRNA from moDC after 6 h EV incubation and indicated pre-incubations (x-axes) (e) (n = 5). *p < 0.05, ***p < 0.001, using repeated measures ANOVA with Tukey’s Multiple Comparison Test (c) or paired student t-test (a, b, e)
