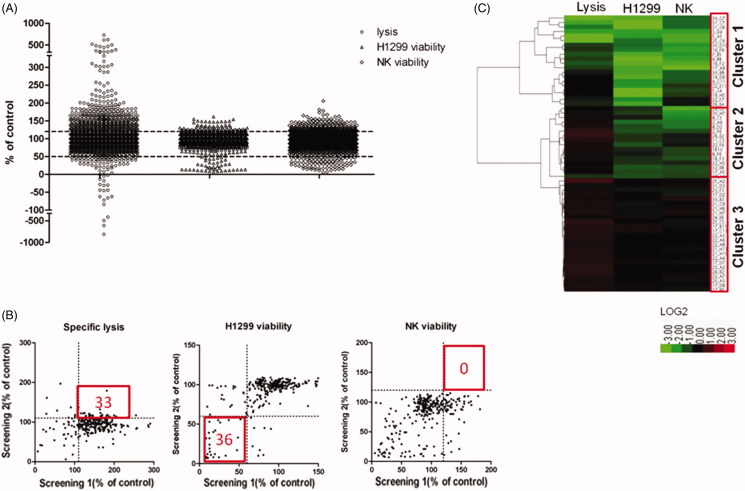
Figure 4.
High-throughput screening of natural products. (A) A scatter plot indicates the percent lysis, H1299 cell viability and NK cell viability of each tested natural product. Dotted lines represent the cut-off ratio (120% for up-regulation and 50% for down-regulation). (B) XY-Scatter plots compare the factors from both replicate screens. (C) Hierarchical clustering of the three factors of each candidate. Clustering is based on Ward’s linkage criteria and the half Euclidean distance metric.

