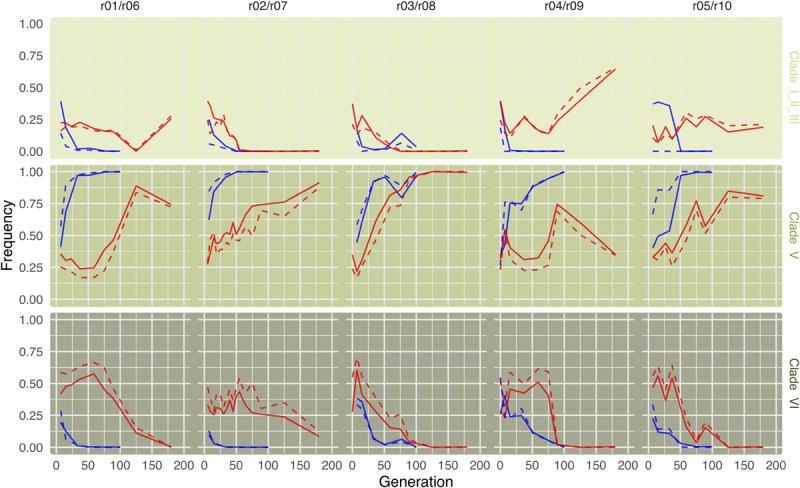
FIGURE 5.

Mitochondrial dynamics on the superclade level are consistent with Wolbachia dynamics. Lines indicated superclade (as defined by Versace et al., 2014) frequencies for both mitochondria (solid lines) and Wolbachia (dashed lines) in cold (blue) and hot (red) environments. While frequencies are based on 155 marker SNPs differentiating among the three superclades, mitochondria frequencies are based on only 21 differentiating marker SNPs (owing to their smaller genome). The grouping of two replicates from different temperature treatments in a panel is random. All replicates evolved independently.
