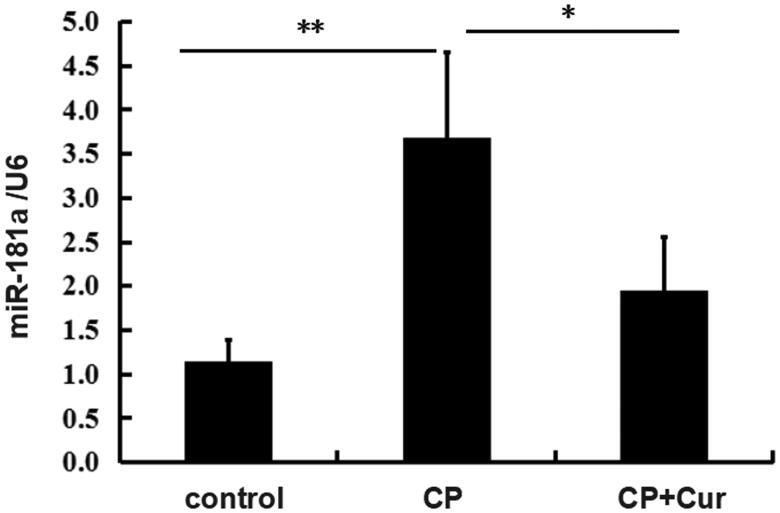
Figure 2.
The miR-181 expression in the kidneys of mice treated with saline (control), cisplatin (CP), cisplatin, and curcumin (CP + Cur). The levels of miR-181 were measured by quantitative real-time PCR (qRT-PCR). U6 was used as the reference gene. Statistical significance was analyzed by one-way ANOVA followed by the Bonferroni test. **p < .01, *p < .05.

