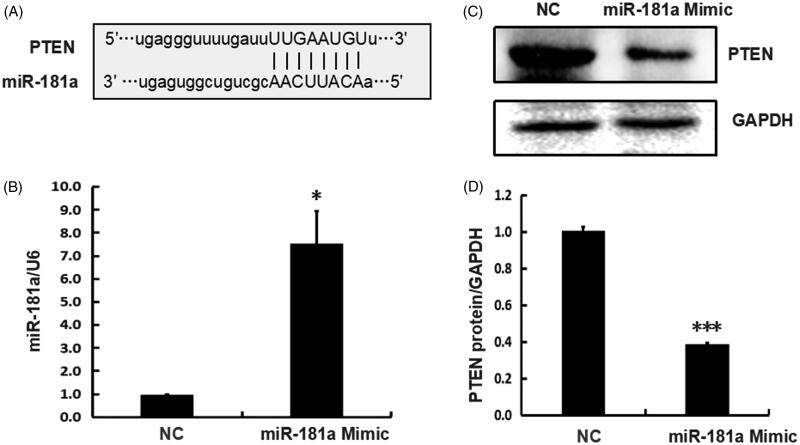
Figure 4.
PTEN is the direct target of miR-181 in vitro. (A) The base-pairing sites of miR-181 and the 3′ UTR of PTEN mRNA, as predicted by bioinformatics software. (B) The miR-181 expression measured by quantitative real-time PCR (normalized to U6) 48 h after transfection with miR-181 mimic or NC in 293T cells. (C) The PTEN protein levels measured by western blotting 48 h after transfection with miR-181 mimic or NC in 293T cells. GAPDH was used as the reference gene. (D) A quantitative analysis of protein levels normalized to GAPDH was by Image J software. Statistical significance analysis was by the two-tailed Student’s t-test.

