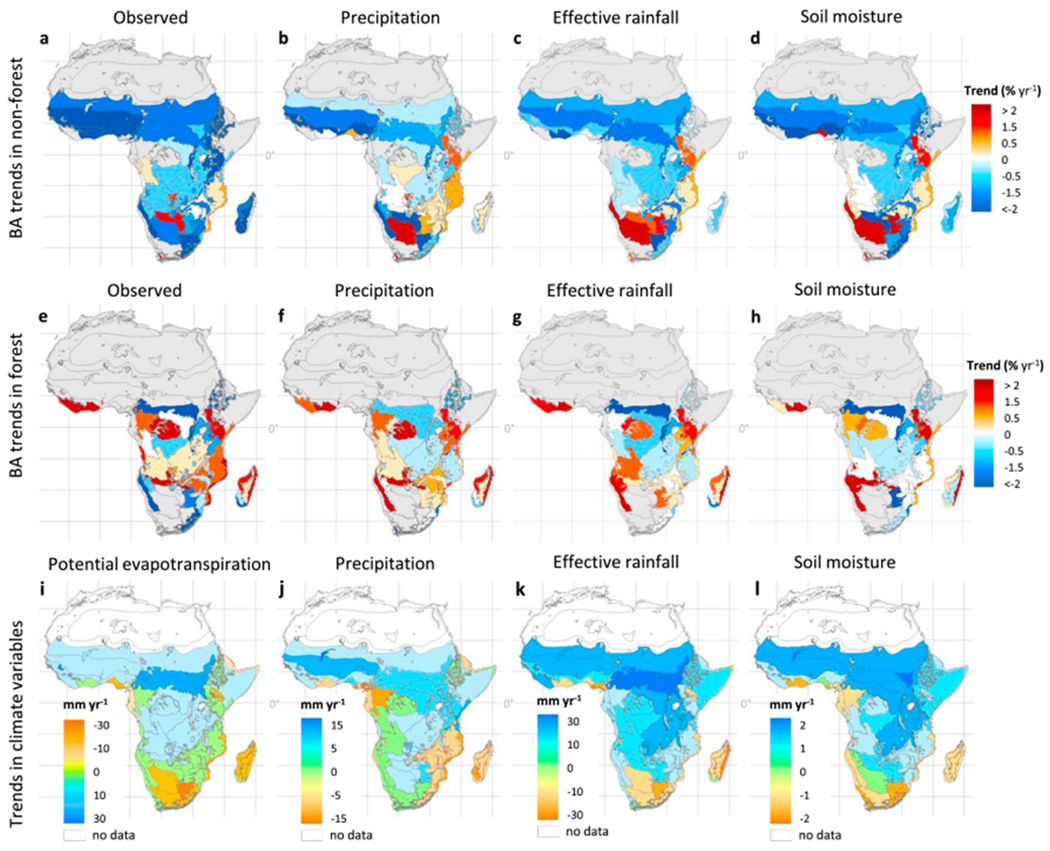
Figure 2.

Linear trends in burned area and climate data. Top row, (a–d) Burned area (BA) trends in nonforest; middle row (e–h) BA trend in forest; bottom row (i–l) trends of climate variables. (a, e) Observed linear trend in burned area; (b, f) modeled linear trends using precipitation as a predictor; (c, g) modeled linear trends using effective rainfall as a predictor; (d, h) modeled linear trends using soil moisture as a predictor. Gray color represents ecoregions with negligible fire activity in each land cover. Graticule lines are every 10°.
