
Fig. 3.
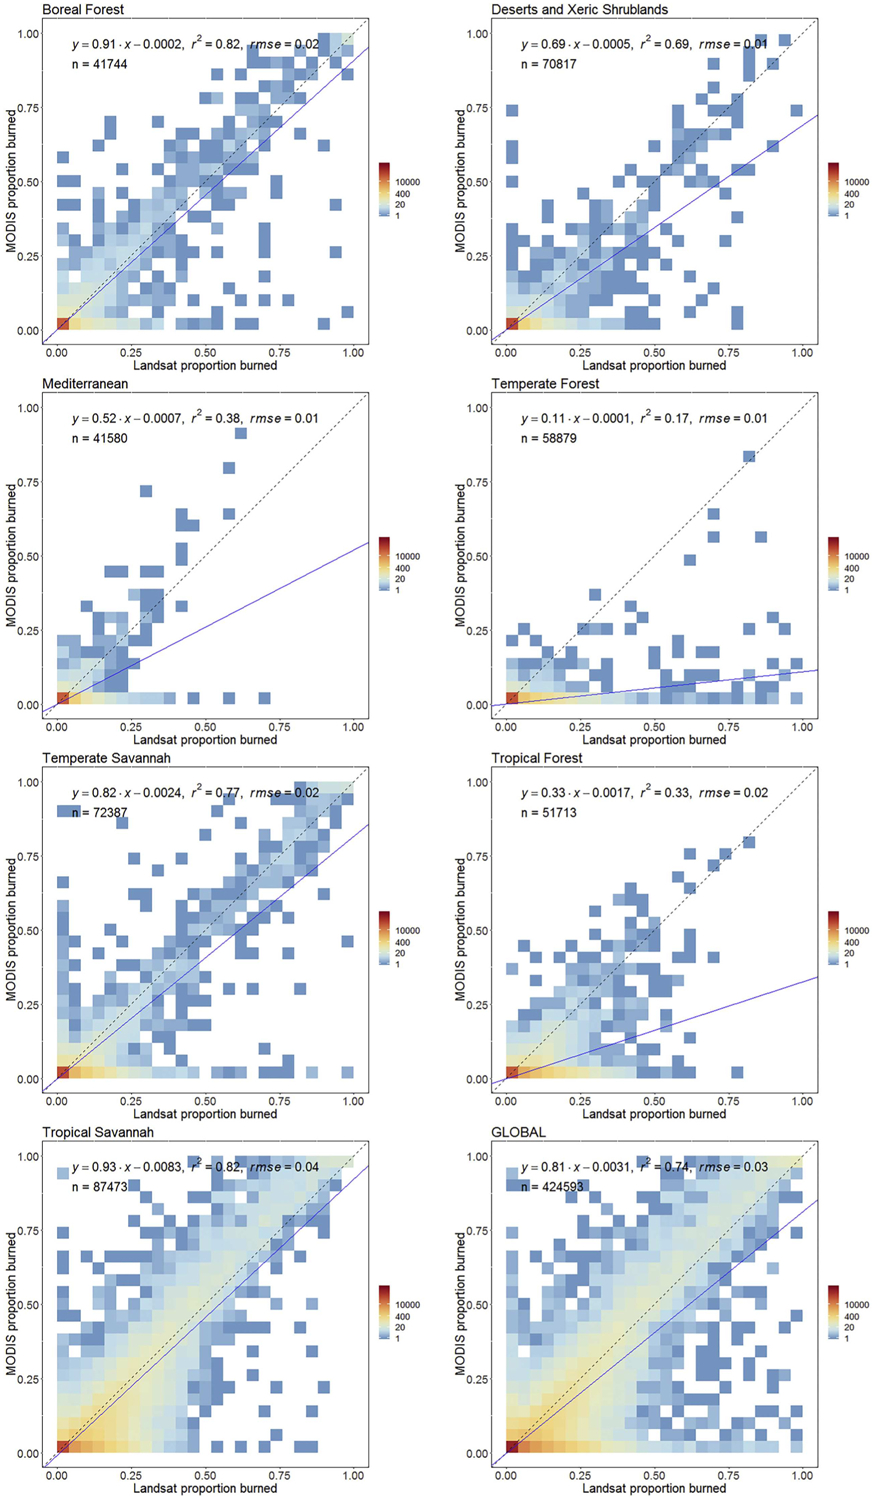
Scatter plot of the proportions of coarse resolution 5 km × 5 km cells labeled as burned by the MCD64A1 product, plotted against the proportion labeled as burned by the Landsat 8 independent reference dataset, combining the voxel results for each biome and globally. The point density distribution is calculated using a 25 × 25 quantization of the plot axes, and is displayed with a logarithmic color scale. The blue lines show the ordinary least squares regression of the proportion data; the dashed 1:1 lines are shown as reference.