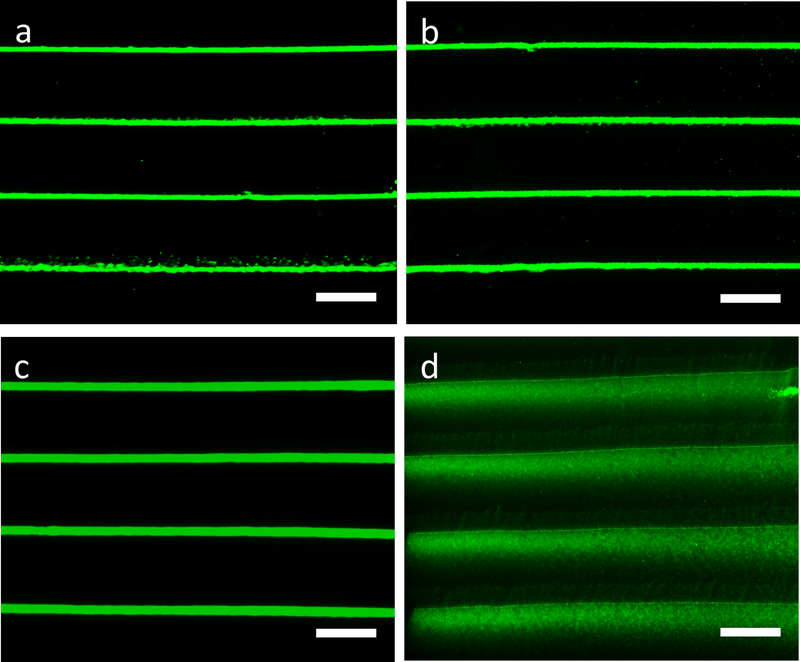
Figure 5.
BSA alignment on the biosilica micropatterns. (a, b) Fluorescence microscopy images of micropatterns containing FITC-labeled BSA and R5 peptide followed by silicification; (c, d) fluorescence microscopy images of micropatterns containing FITC-labeled BSA alone followed by silicification. Fluorescence microscopy images of micropatterns in PBS at day 1 (a, c), day 6 (b, d). The distinctive FITC-BSA stripes in the FITC-BSA/R5/silica micropatterns reveal the spatial control of protein alignment using this design, in comparison to the extended distribution of the control FITC-BSA micropatterns. Scale bars: a, b, c, d, 400 μm.

