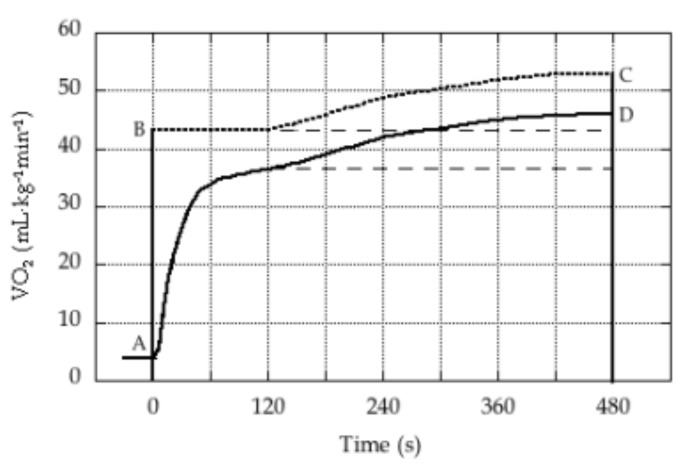
Figure 1.
Responses in an exhaustive bout of severe intensity exercise. The solid curve (AD) represents the VO2 response, while the dotted curve (BC) represents the oxygen demand. The area described by ABCD is the oxygen deficit. Dashed lines identify responses had there been no increase in oxygen demand and no increase in VO2, and illustrate the effect of assuming that the oxygen demand does in fact increase during the exercise bout.

