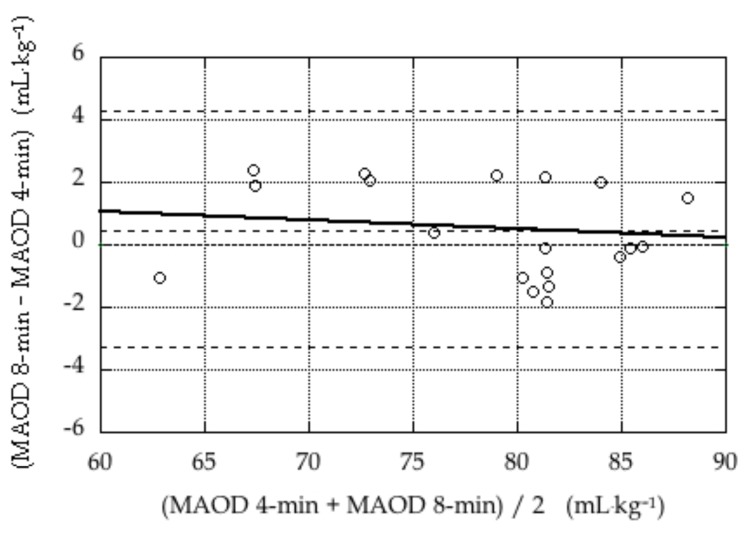
Figure 2.
The Bland-Altman plot of MAOD values obtained using the alternate method (which assumes that the oxygen demand increases over time during exhaustive severe intensity exercise) with the data from 4-min tests (MAOD 4-min) and 8-min tests (MAOD 8-min). The dashed lines in the figure indicate the mean difference (bias; 0.5 ± 1.5) and the mean ± 2 × SD. The solid line represents the linear regression of the difference against the mean (difference = 2.7 – 0.03 × mean), which was not statistically significant.

