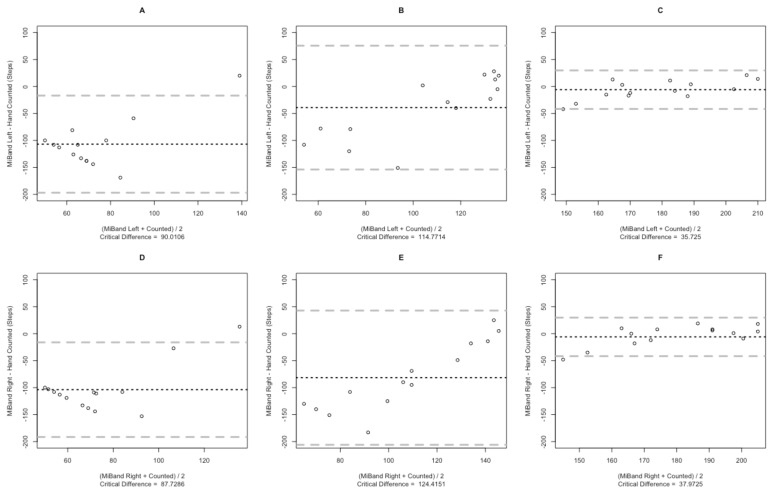
Figure 2.
Bland-Altman plots depicting step measurement bias of the Mi Band during treadmill test: A) Mi Band worn on the left wrist during 1.28 km/h; B) Mi Band worn on the right wrist during 1.28 km/h; C) Mi Band worn on the left wrist during 1.92 km/h; D) Mi Band worn on the right wrist during 1.92 km/h; E) Mi Band worn on the left wrist during 2.88 km/h; F) Mi Band worn on the right wrist during 2.88 km/h. Solid horizontal line = mean error score, dashed lines = 95% predicted intervals.

