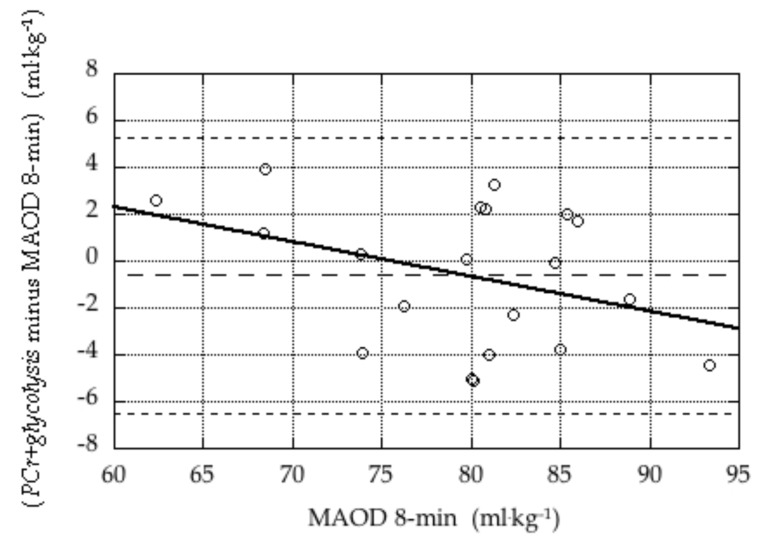
Figure 2.
Bland-Altman plot of difference in estimates of anaerobic capacity during the 8-min tests (PCr+glycolysis minus MAOD 8-min) versus the criterion measure (MAOD 8-min). The three dashed lines indicate the mean difference (bias; −0.6 ± 3.0 mL·kg−1) and the mean ± 2 × SD. The solid line represents the linear regression of the difference against the criterion (difference = 11.2 – 0.15 × mean), which was not statistically significant (p = 0.20).

