
Extended data Figure 7. Sex-specific distribution of IL-33+ VAT stromal cells and VAT Treg cell response to IL-33 administration.
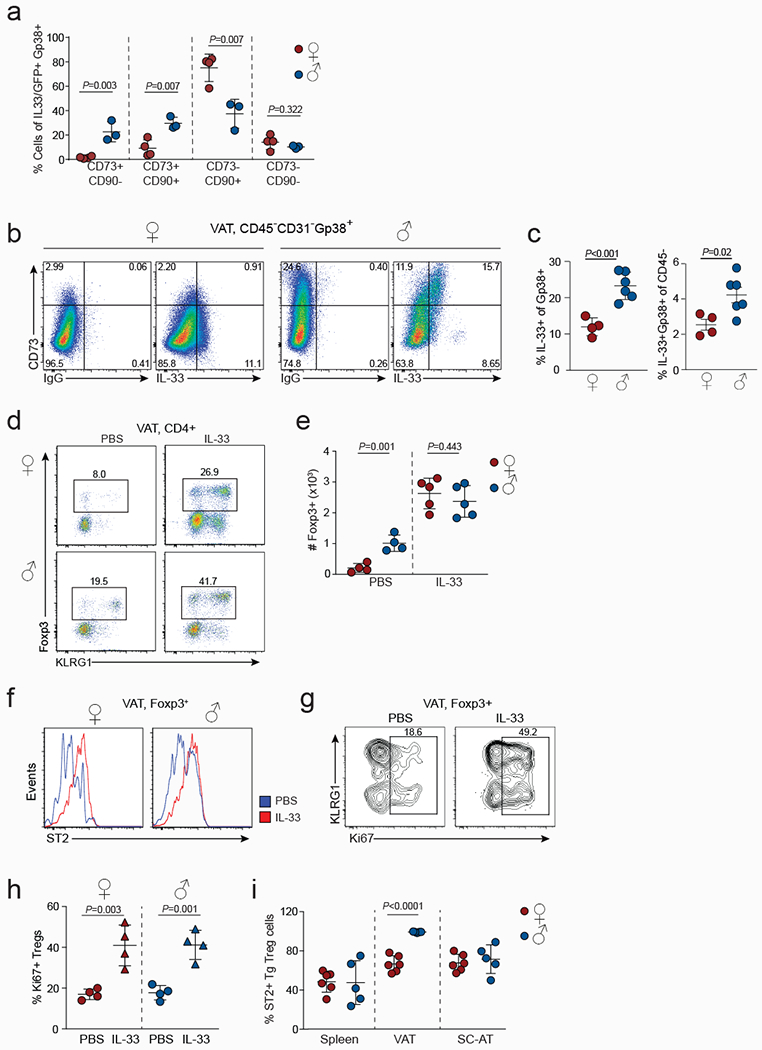
a, Percentages of IL-33+ cells within each VAT Gp38+ stromal cell compartment of female (n=4) and male (n=3) wildtype (WT) mice. b, IL-33 expression in CD45-CD31-Gp38+ stromal cells as measured by intracellular staining. IgG was used as a control. c, Percentages of IL-33+ cells within the VAT Gp38+ stromal cell compartment of WT female (n=4) and male (n=6) mice (left) and percentages of IL-33+Gp38+ of live cells in VAT (right). d-h, IL-33 (n=5) or PBS (mock) (n=4) was administered to 12-week-old male and female WT mice. Expression of Foxp3 and KLRG1 in VAT CD4+ T cells (d), numbers of VAT Treg cells (e), ST2 expression in VAT Treg cells from IL-33 or PBS treated (f), expression of KLRG1 and Ki67 in VAT Treg cells of male mice (g), and quantification of Ki67+ VAT Treg cells in female (n=4) and male (n=4) WT mice (h). i, Treg cells were sorted from the spleens of transgenic mice expressing a VAT-specific T cell receptor25 and transferred into congenically marked female (n=6) or male (n=5) mice. Percentages of ST2+ TCR transgenic (Tg) Treg cells within the adipose tissue 12 weeks after adoptive transfer. Unpaired t-test (2-tailed) was performed. Data are mean ± s.d. Data pooled or representative of two independent experiments.