
Extended data Figure 10. Blimp1 regulates putative VAT Treg cell precursors, diverse functions of IL-6 in the VAT, and a model of the sex-hormone mediated circuitry that mediates recruitment, expansion and function of VAT Treg cells.
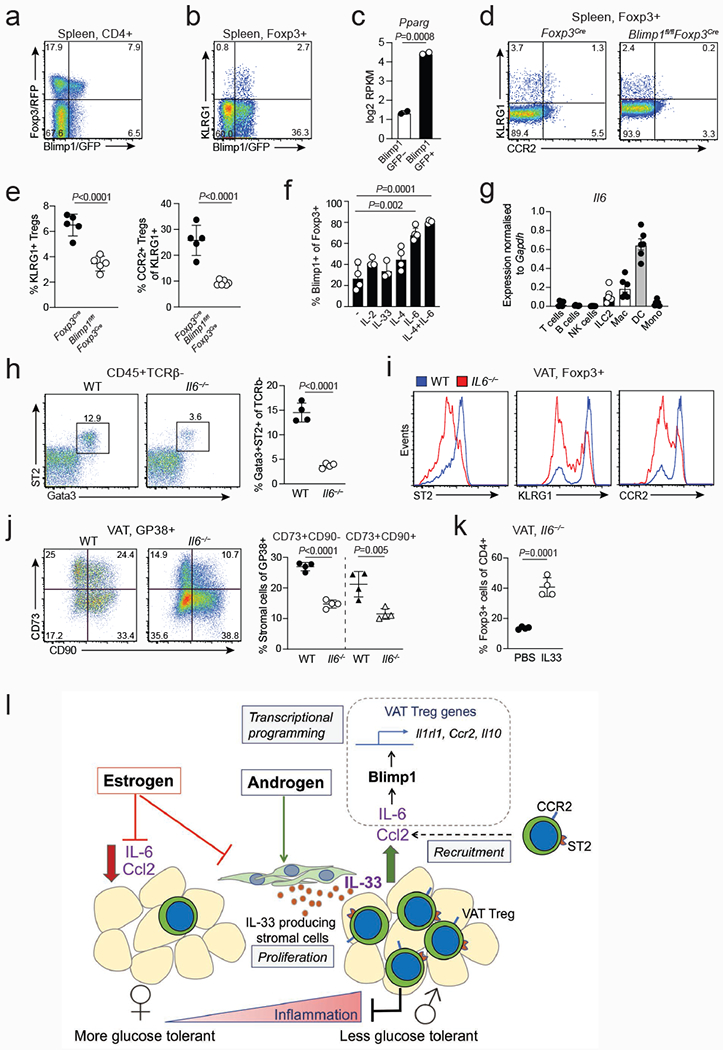
a, Expression of Foxp3 and Blimp1 in splenic CD4+ T cells from Foxp3RFPBlimp1GFP mice. b, Expression of Blimp1/GFP and KLRG1 in splenic Treg cells. c, Pparg expression in Blimp1/GFP+ vs Blimp1/GFP− splenic Treg cells. Bar graph generated from RNAseq read counts26. d, Expression of KLRG1 and CCR2 in splenic Treg cells from Foxp3Cre and Blimp1fl/flFoxp3Cre mice. e Graphs on the right show percentages of KLRG1+ cells among splenic Treg cells of Foxp3Cre (n=5) and Blimp1fl/flFoxp3Cre (n=6) mice and percentages of CCR2+ cells within the KLRG1+ fraction of splenic Treg cells. f, Proportion of Blimp1/GFP+ Treg cells obtained after Blimp1/GFP-Treg cells sorted from Foxp3RFPBlimp1GFP mice were cultured in the presence of indicated cytokines (n=3-4). g, Expression of Il6 transcripts as measured by quantitative PCR in hematopoietic cell populations sorted from the male VAT (n=6). h, Flow cytometry plots (left) and quantification (right) of ILC2s in the VAT of male WT (n=4) and Il6−/− (n=4) mice. i, Flow cytometry histograms show expression of indicated markers in WT and Il6−/− VAT Treg cells. j, Expression of CD73 and CD90 in WT (n=4) and Il6−/− (n=4) VAT Gp38+ cells (left). Percentages of CD73+CD90− and CD73+CD90+ stromal cells in the VAT of male WT (n=4) and Il6−/− (n=4) mice (right). k, Percentages of VAT Treg cells in male Il6−/− mice treated with PBS or IL-33. Unpaired t-test (2-tailed) was performed. Data are mean ± s.d. Data pooled or representative of two independent experiments. l, Model of the sex-hormone mediated circuitry that mediates recruitment, expansion and function of VAT Treg cells. Treg cells are recruited to the VAT in a CCL2/CCR2-dependent manner. IL-6 induces the expression of transcription factor Blimp1, which in turn activates expression of prototypical VAT-Treg signature genes IL-33 receptor ST2, CCR2 and IL-10. IL-33 production by androgenresponsive stromal cells leads to local expansion of VAT Treg cells in the male VAT, whichin turn mediate repression of VAT inflammation.