
Extended data Figure 3. Opposing functions of male and female sex-hormones in regulating VAT inflammation, Treg cell recruitment and glucose tolerance.
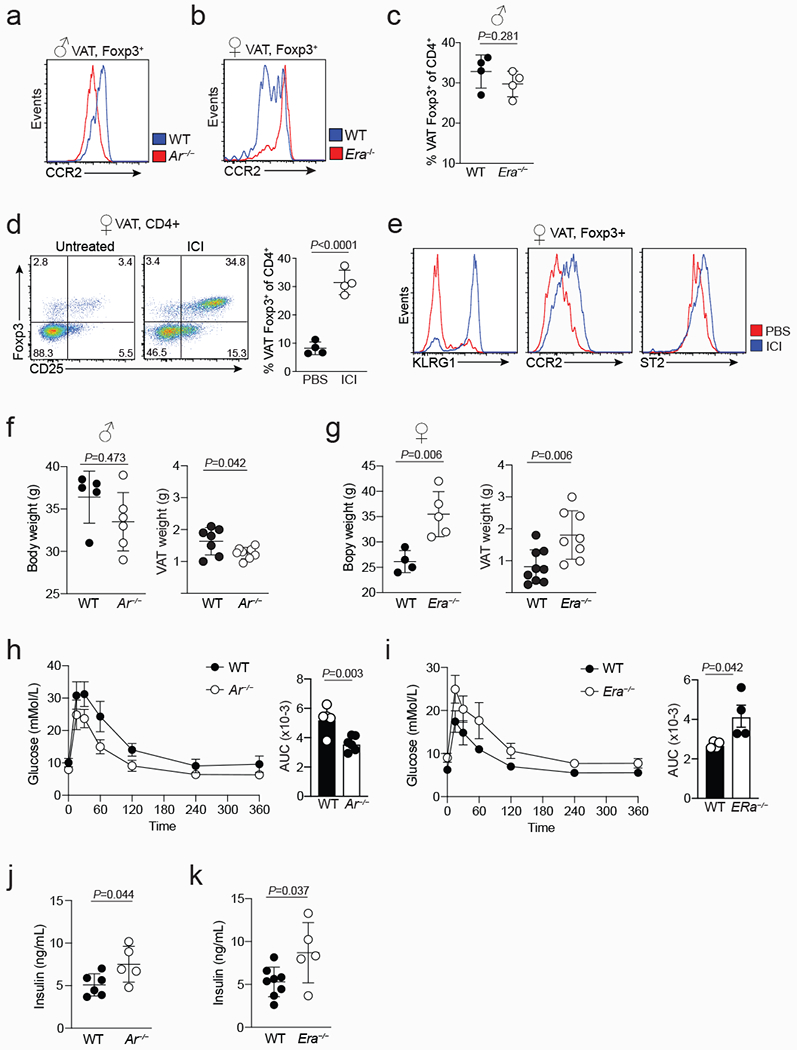
a, Representative flow cytometry histograms showing expression of CCR2 in wildtype (WT) and Ar−/− VAT Treg cells (a), and WT and Era−/− VAT Treg cells (b). c, Frequency of VAT Treg cells in male WT and Era−/− mice (n=4 of each genotype). d, Flow cytometry plots (left) show VAT Treg cells from control and ICI treated female mice, and graph (right) shows quantification (n=4 for both conditions). e, Expression of indicated markers in control and ICI treated female VAT Treg cells. f, Body mass (left) (n=5 WT; n=6 Ar−/−) and VAT mass (right) (n=7 WT; n=8 Ar−/−) from 20 to 25-week-old male WT and Ar−/− mice. g, Body mass (left) (n=4 WT; n=5 Era−/−) and VAT mass (right) (n=9 WT; n=8 Era−/−) from 20 to 25-week-old female WT and Era−/− mice. h, i, Oral glucose tolerance test (left) and area under the curve (right) comparing age-matched male WT and Ar−/− mice (n=4 WT; n=5 Ar−/−) (h), or female WT and Era−/− mice (n=4, WT and Era−/−) (i). j, k, Fasting serum insulin levels in WT (n=6) and Ar−/− (n=5) male mice (j), and in WT (n=8) and Era−/− (n=5) female mice (k). Unpaired ttest (2-tailed) performed. Data are mean ± s.d. Data pooled or representative of two independent experiments.