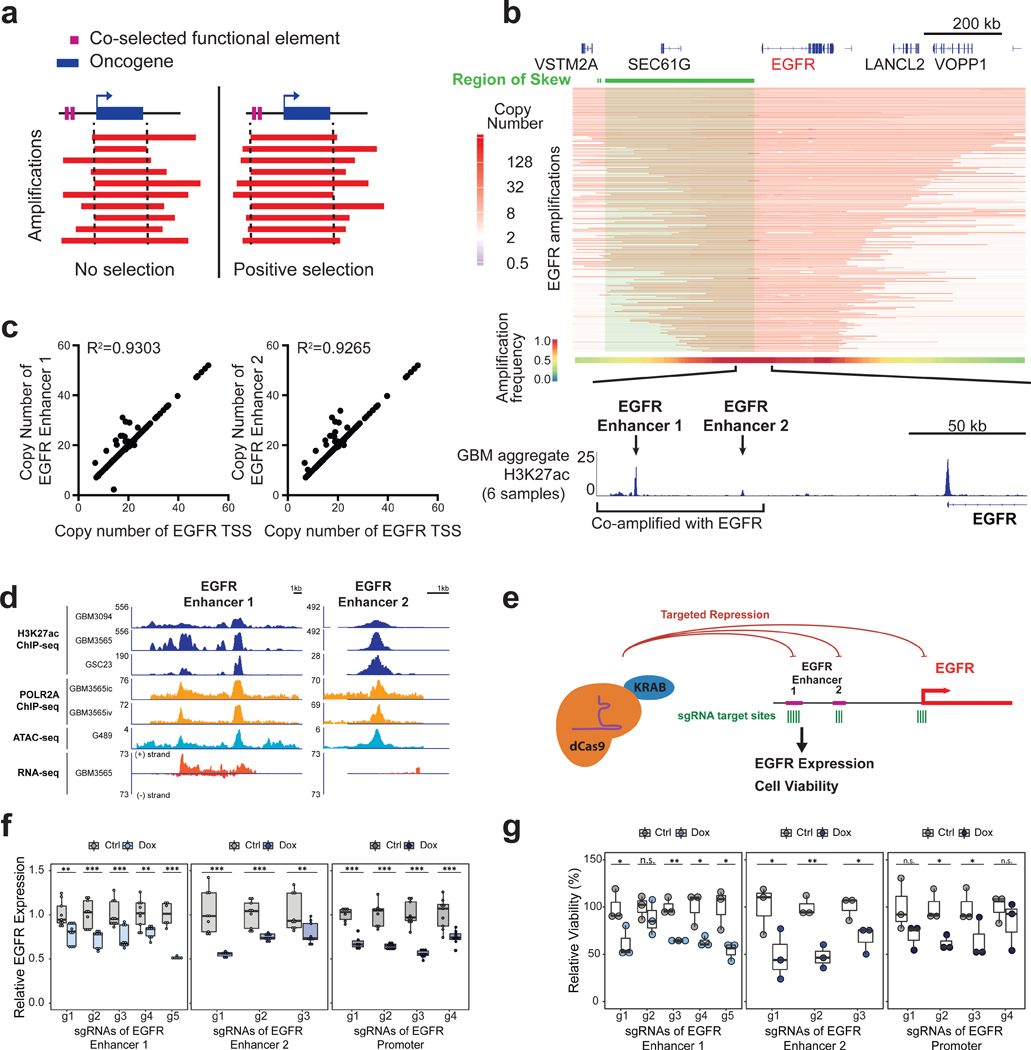
Figure 1. Skewing of EGFR focal amplifications to two upstream enhancer elements.
(a) Model for positive selection of functional elements on amplicons. (b) (From top-to-bottom) Green highlights region of skew from the Monte Carlo simulation (P < 0.0001). Heatmap depicting the EGFR amplicons across 174 glioblastoma samples. The aggregate heatmap summarizes the frequency of amplification across the cohort. (Bottom) magnified view of the co-amplified H3K27ac peaks (from an aggregate of six glioblastoma models) upstream of EGFR. (c) Copy number for the EGFR transcription start site (TSS) (x axis) versus copy number of each upstream enhancer (y axis) across EGFR-amplified glioblastoma samples. (d) H3K27ac ChlP-seq, ATAC-seq, POLR2A ChlP-seq, and RNA-seq signals at two EGFR enhancers for four glioblastoma lines (GBM3565, GBM3094, GSC23, G459). (e) Experimental scheme for EGFR repression by CRISPRi using a doxycycline-inducible KRAB-dCas9 construct designed to target EGFR enhancers and promoter in G361 glioblastoma cell cultures. (f) RT-qPCR EGFR expression in G361 with multiple sgRNAs targeting EGFR enhancers 1 and 2 and a comparison of the promoter in induced and uninduced cells (N=3 experiments per sgRNA with 2–3 technical replicates). (g) Cell viability as assayed by Alamar blue in induced and uninduced cells after 8 days of culture, following sgRNA targeting of the EGFR enhancers and promoter (N=3 experiments per sgRNA). A t-test was used for significance (* p≤0.05, ** p≤0.01, *** p≤0.001 compared to the untreated control using all technical replicates). See also Figure S1.

