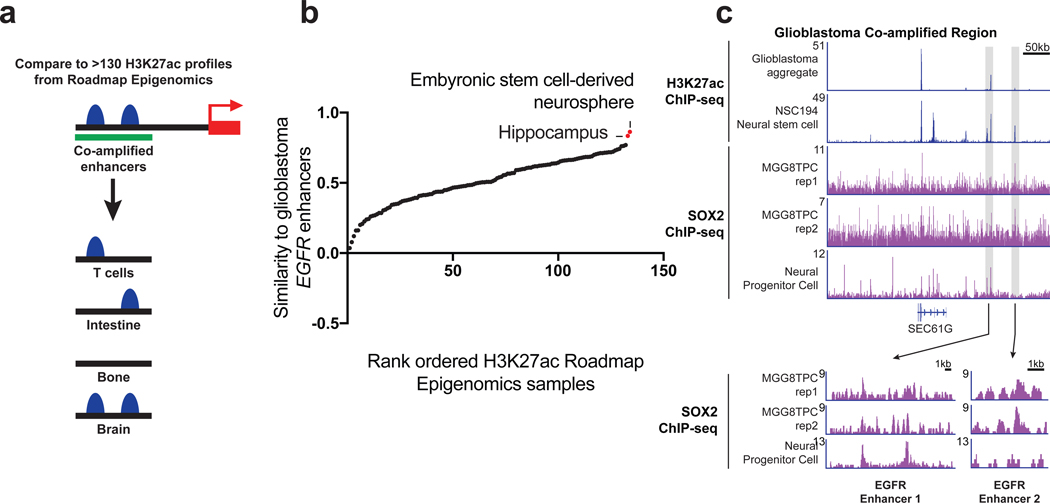
Figure 2. Selection of tissue-specific enhancers by EGFR amplicons.
(a) Model of tissue specific enhancer analysis. (b) Pearson correlation to measure the similarity between the H3K27ac enhancer profiles within the region of skew of normal tissues and the profile of GSC23 for EGFR in glioblastoma. The top scoring tissues are labelled. (c) ChlP-seq tracks for H3K27ac and SOX2 in the EGFR region of skew in glioblastoma cell lines (aggregate track, MGGTPC) and neural stem cells (NSC194, neural progenitor cell). (Bottom) Zoom in of SOX2 signal for EGFR enhancer 1 and enhancer 2.

