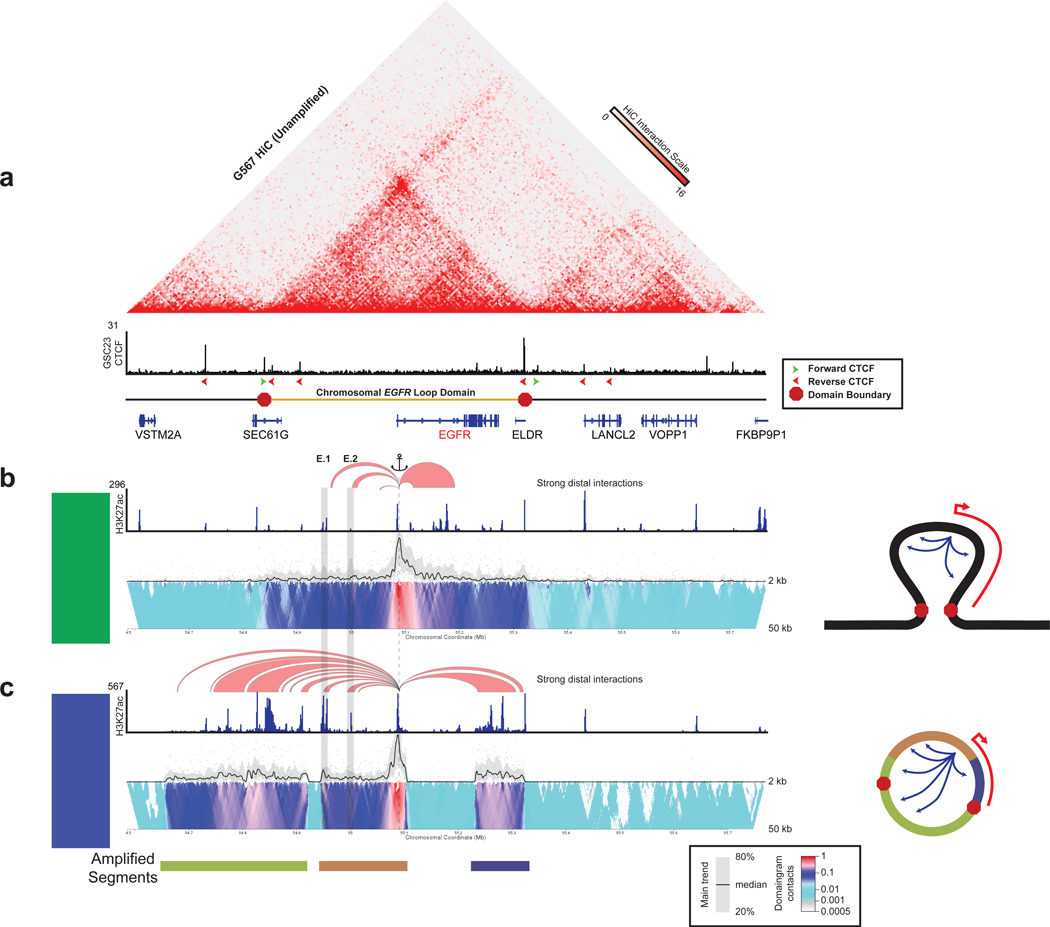
Figure 4. Topology of the EGFR locus in unamplified and amplified glioblastoma.
(a) (Top) HiC contact map of unamplified glioblastoma model cell line G567. (Middle) CTCF ChlP-seq track of unamplified glioblastoma model cell line GSC23. The red and green arrows denote the orientation of the CTCF motif. (Bottom) Schematic of the boundaries of the loop domain. (b) 4C-seq profiles anchored from near the EGFR transcription start site (dotted line) showing interactions to the EGFR enhancers (boxed) for GSC23 (unamplified). Red arcs denote regions with strong distal interactions with EGFR at a 12 kb window thresholded at a 0.12 interaction frequency. H3K27ac ChIP-seq tracks accompany the 4C-seq data. The 4C-seq tracks consist of a main trend of the chromatin interactions based on a 5 kb window and domainogram colored by interaction frequency. Right side depicts a model for the toplogy of the locus. (c) Same as (b) for GBM3565 (EGFR amplified). See also Figure S4.

