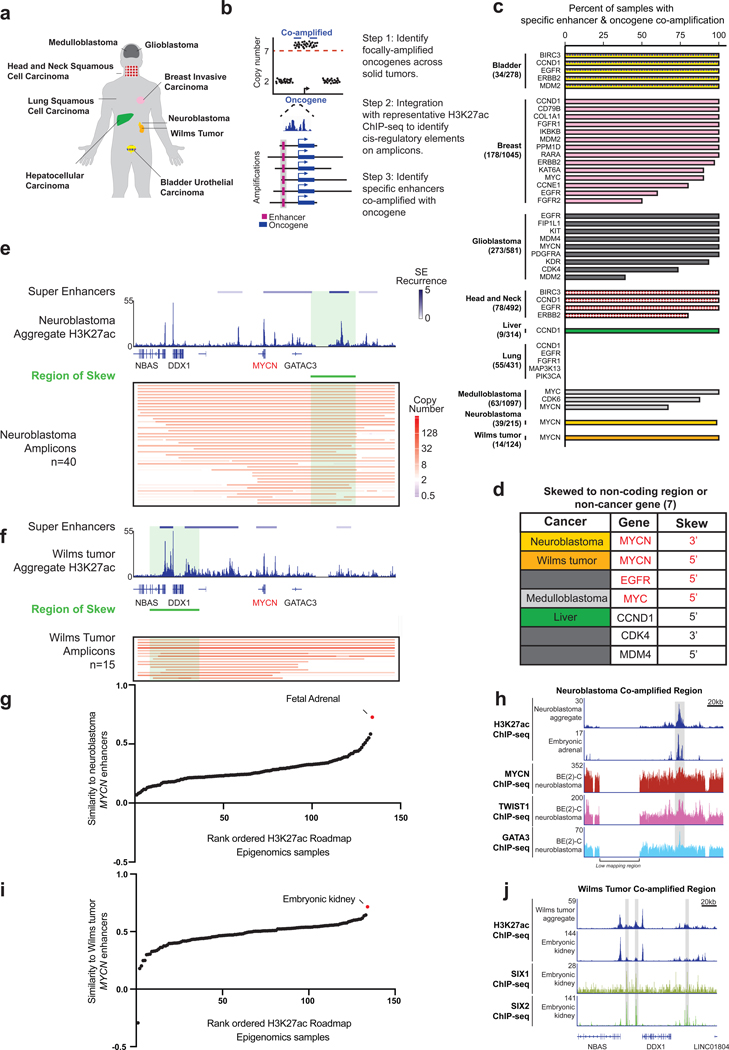
Figure 6. Multi-cancer analysis of enhancer selection on oncogene amplicons.
(a) Solid tumors analyzed in this study. (b) Workflow for pan-cancer identification of oncogene-enhancer co-amplification. (c) Bar chart showing the proportion of samples containing a co-amplified enhancer. The most frequently co-amplified enhancer is plotted; other enhancers may be present at a lower frequency. (d) Oncogenes showing amplicon-skew in indicated cancers. (e) MYCN amplification skewing data for neuroblastoma showing inclusion of a downstream super-enhancer. (Top-bottom) Super-enhancers colored by recurrence number detected in MYCN-unamplified neuroblastoma cell lines and aggregated H3K27ac ChIP-seq data from these 12 lines (top). Copy number profile of 40 neuroblastoma tumors, with the region of skew indicated by the green bar (P < 0.0001 by Monte Carlo simulation) (bottom). (f) MYCN amplification skewing in Wilms tumor includes an upstream super-enhancer. (Top-bottom) Super-enhancers colored by recurrence number detected in MYCN-unamplified primary Wilms tumor samples and aggregated H3K27ac ChlP-seq data from samples of these 5 tumors (top). Copy-number profile of 15 Wilms tumors, with the region of skew indicated by the green bar (P < 0.0001 by Monte Carlo simulation) (bottom). (g) Pearson correlation to measure the similarity between the H3K27ac enhancer profiles within the region of skew of normal tissues and the profile of CLB-GA neuroblastoma cell line. The top scoring tissues are labelled. (h) ChlP-seq tracks for H3K27ac and the lineage-enriched factors MYCN, TWIST1, and GATA3 from the MYCN region of skew in neuroblastoma, as assessed within the neuroblastoma aggregate track, an embryonic adrenal sample from Roadmap Epigenomics data, and the MYCN-amplified neuroblastoma cell line BE(2)C. (i) Same as (g) except the normal tissues were compared to the profile of Wilms tumor 5. The top scoring tissues are labelled. (j) ChlP-seq tracks for H3K27ac and lineage-enriched factors SIX1 and SIX2 from the MYCN region of skew in Wilms tumor, as assessed in the Wilms tumor aggregate track and embryonic kidney samples. See also Figure S6.

