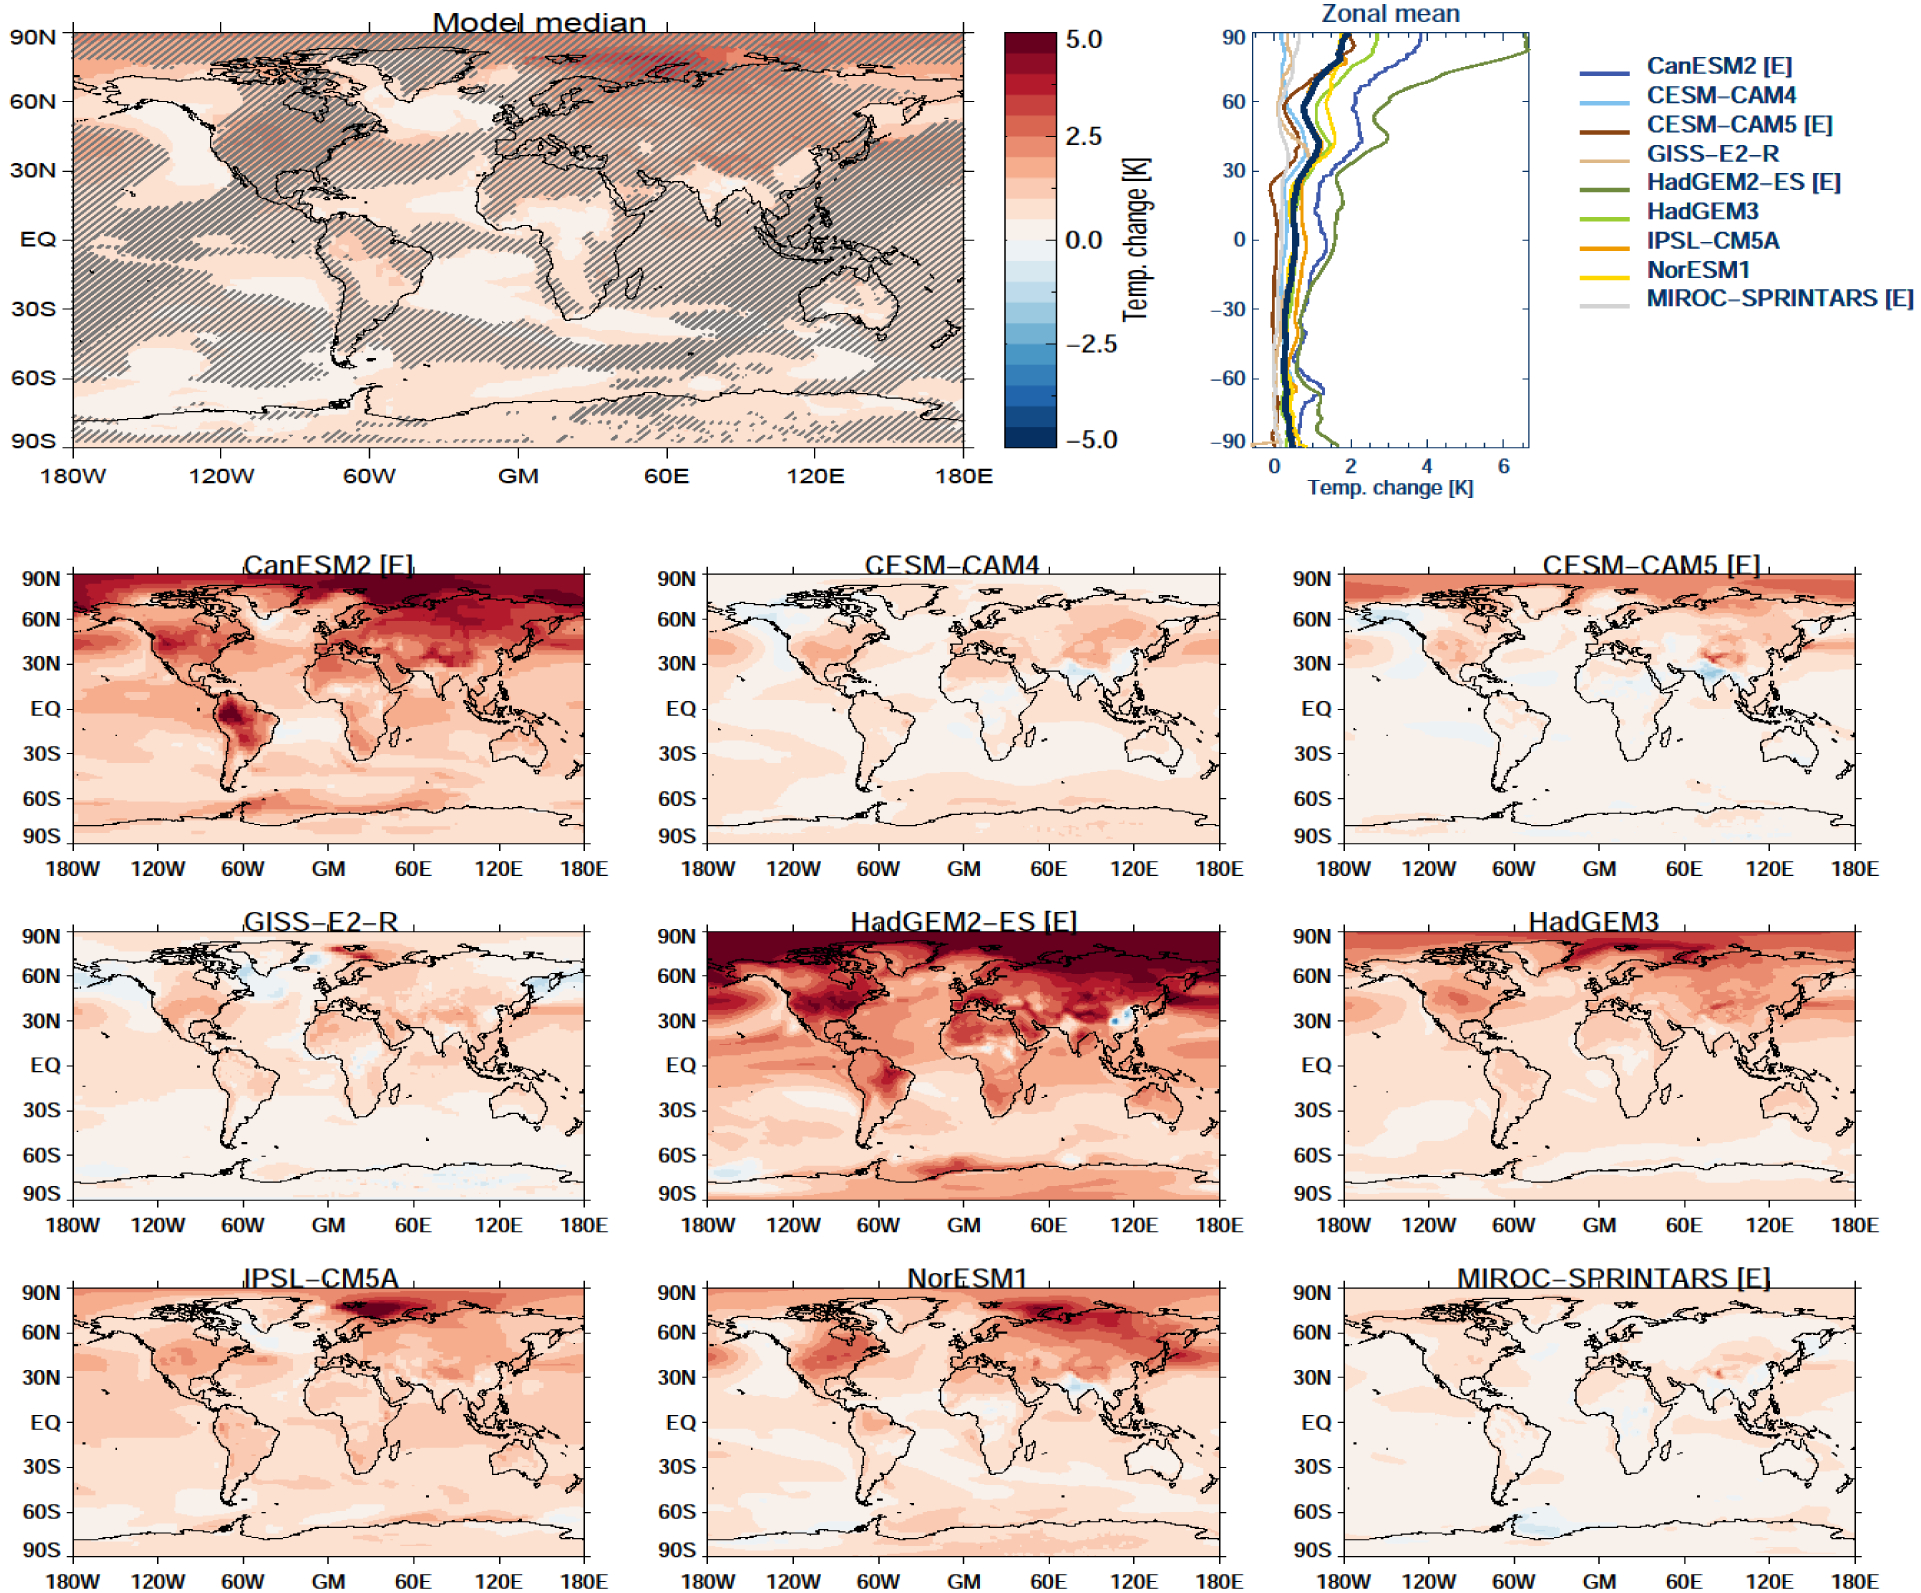
Figure 3:

Annual mean model median change in near surface temperature (upper left), as well as zonally averaged temperature change for the model median (black line) and individual models (upper right). The remaining panels show individual model results. Data are based on the last 50 years of the coupled runs, and hatched areas in the model median map indicate grid cells for which values are more than one multi-model standard deviation away from zero.
