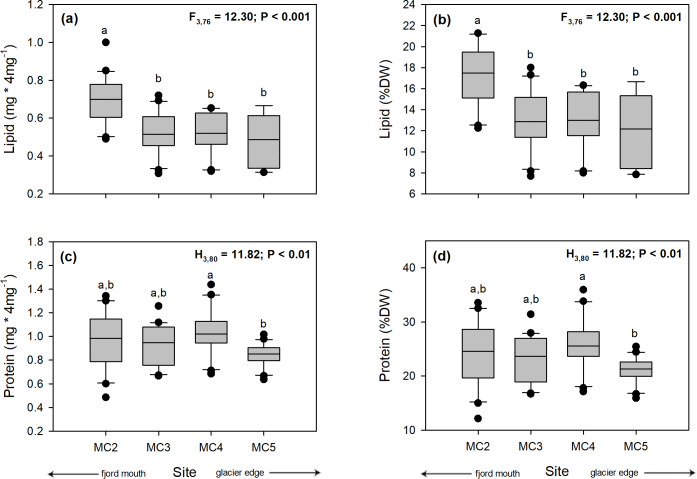
Fig 5.
Boxplot of the spatial variation of: (a) lipid content (mg * 4mg–1), (b) lipid content (% DW), (c) protein content (mg * 4mg–1), and (d) protein content (% DW) among adult individuals of N. inaequisculpta collected four sites (MC2 to MC5) at progressive distance from a melting glacier (MC2 distal, MC5 proximal) Marian Cove, WAP. Different letters on box indicate significant differences among sites after Tukey’s HSD test. Measurements are given as average values ± SD (n = 80).

