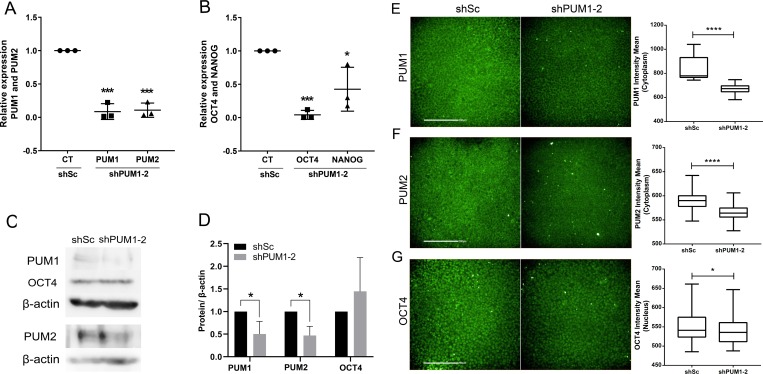
Fig 1. Knockdown of PUM1 and PUM2 affects the expression of OCT4 and NANOG mRNA.
(A-B) Analysis of the relative expression of PUM1 and PUM2 (A) and of NANOG and OCT4 (B) in hESCs 24 h after transduction of lentiviral vectors containing shSc and shPUM1-2 (n = 3). (C-D) Western blot analysis of PUM1 (140 kDa), PUM2 (114 kDa) and OCT4 (40 kDa) expression in protein extracts from cells in which PUM1-2 was silenced. The β-actin (45 kDa) protein was used as a loading control (n = 3). (E-G) The PUM1, PUM2 and OCT4 immunostaining intensity of each individual cell (n = 74,000 cells) was analyzed using Operetta CLS and Harmony 4.5 software (Perkin Elmer); for each sample, 25 images (20X objective) in triplicate were analyzed. Representative immunostaining images and quantified intensity of PUM1 (E), PUM2 (F) and OCT4 (G) 48 h after transduction of lentiviral vectors containing shSc and shPUM1-2 are shown. Scale bars: 200 μm. *p<0.05, **p<0.01, ***p<0.001, ****p<0.0001.

