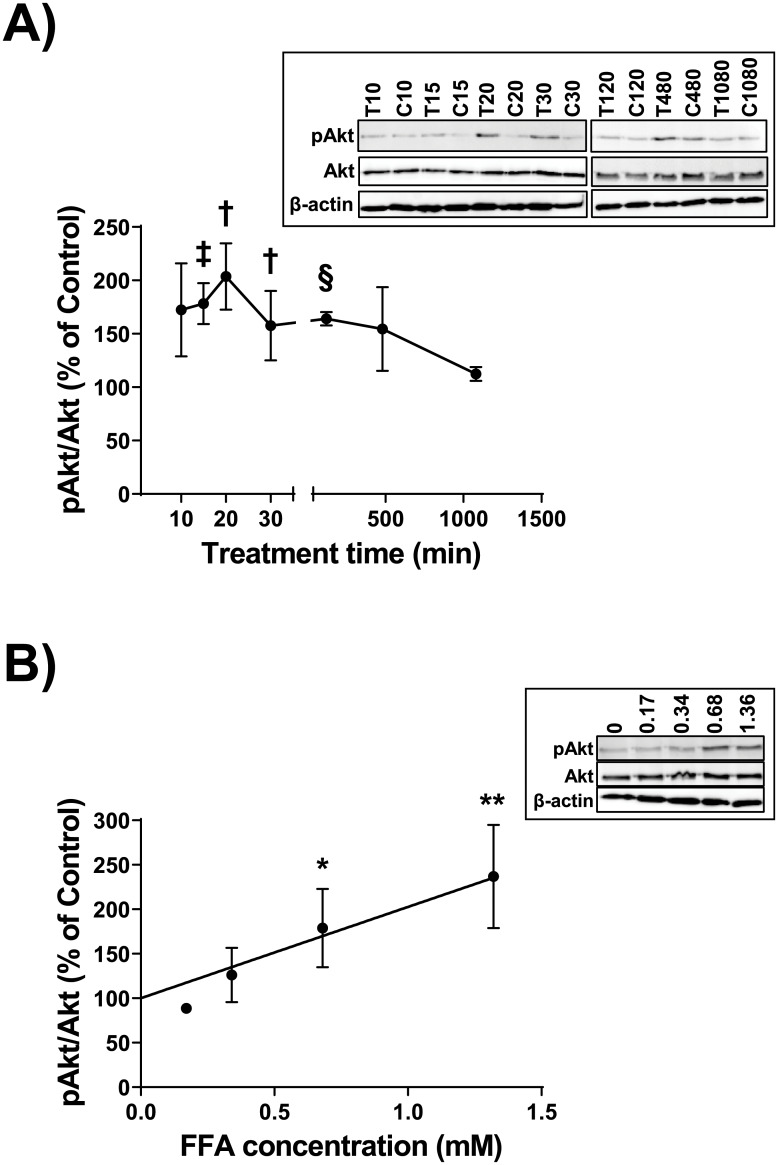
Fig 1. Time course and dose response of Akt phosphorylation.
A. THP-1 macrophages were incubated for 0, 10, 15, 20, 30, 120, 420, or 1080 minutes with either a vehicle control (Control or C), or a 0.68 mM mixture of purified FFA (T) that matched the ratios observed post-hydrolysis of total human lipoprotein lipids by LPL. Cell lysates were collected and proteins were subjected to immunoblot analyses. Densitometry of Akt and pAkt were assessed; data are expressed as the ratio of pAkt to total Akt, as a percent of Control. Data are means `SE from three independent experiments, and statistical analysis was performed using multiple t-testing (uncorrected: †, p = 0.03; ‡, p = 0.008; §, p = 0.0003). Following a Bonferroni-Dunn correction (with α = 0.05), only the 120 minute data retained significance (p = 0.004). Inset, one complete set of immunoblot results from the three independent experiments. The complete set of uncropped immunoblots can be found in S8 Fig. B. THP-1 macrophages were incubated for 2 hours with either a vehicle control (Control), or a mixture of purified FFA that matched the ratios observed post-hydrolysis of total human lipoprotein lipids by LPL; concentrations of 0 mM, 0.17 mM, 0.34 mM, 0.68 mM, and 1.38 mM were tested. Analyses of cell lysates were performed as in “A”. Data are from three independent experiments, and statistical analysis was performed using regression analysis (R2 = 0.49, p = 0.01) and a t-test (*, p = 0.02; **, p = 0.005). Inset, one complete set of immunoblot results from the three independent experiments. The complete set of uncropped immunoblots can be found in S9 Fig.

