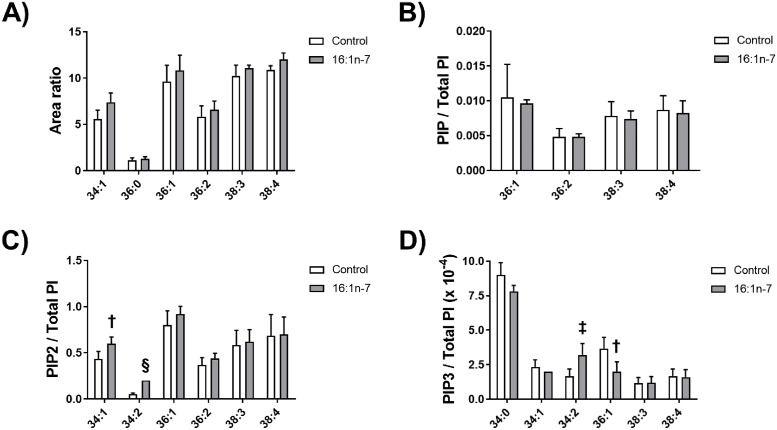
Fig 3. Analyses of PIPx species in response to palmitoleate treatment.
THP-1 macrophages were incubated for 18 hours with either a vehicle control (Control) or 0.02 mM palmitoleate (16:1n-7). Lipids were extracted from cell lysates; A, PI species; B, PIP species; C, PIP2 species; and D, PIP3 species were quantified. Data in “A” are expressed as a ratio of area under the curve of the examined species to the area under the curve of the standard PI; data in “B”, “C”, and “D” are expressed as a ratio of intensity per total PI. Control data are from six independent experiments and palmitoleate-treatment data are from five independent experiments. Statistical analysis was performed using a t-test (†, p = 0.006; ‡, p = 0.005; §, p<0.0001).

