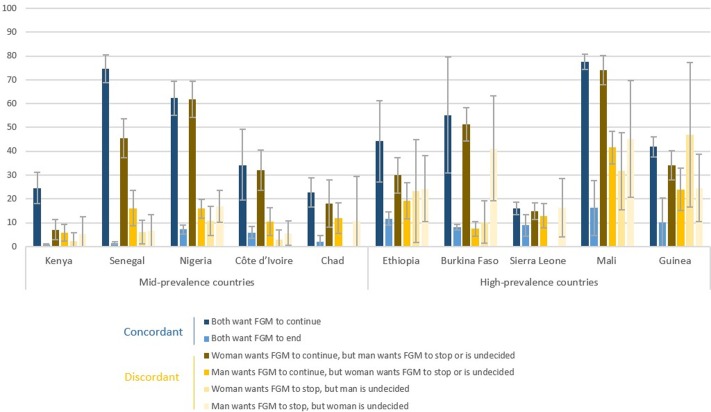
Fig 2. Percentage of daughters who have undergone FGM, by parental opinions about the continuation of the practice.
More detailed results are included in S2 Table, including p values (<0.0001 for all countries). Missing bars represent results that were suppressed because they were based on fewer than 25 unweighted cases.

