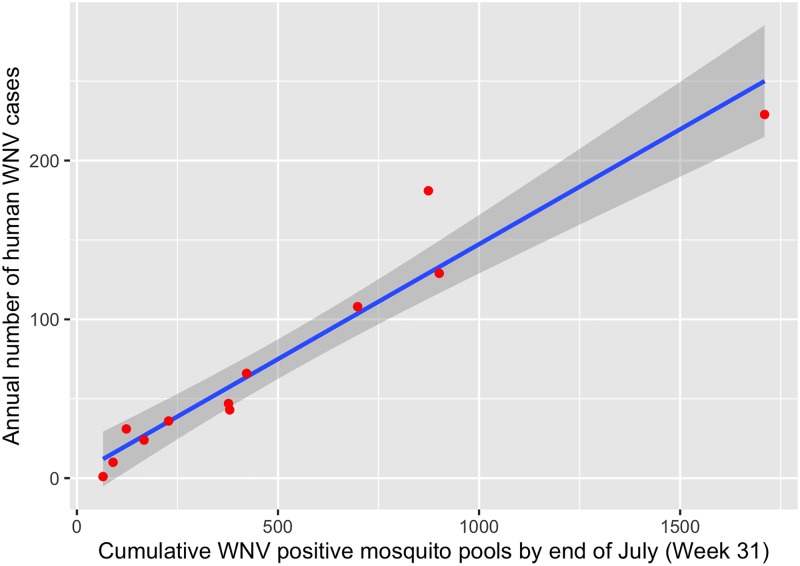
Fig 3. The relationship between annual human WNV infections and a cumulative number of WNV positive mosquito pools from 2005–2014 in Cook and DuPage counties, Illinois.
Blue line indicates the best-fit linear regression line, with gray shading indicating 95% confidence intervals. Red points are observations (one per year).

