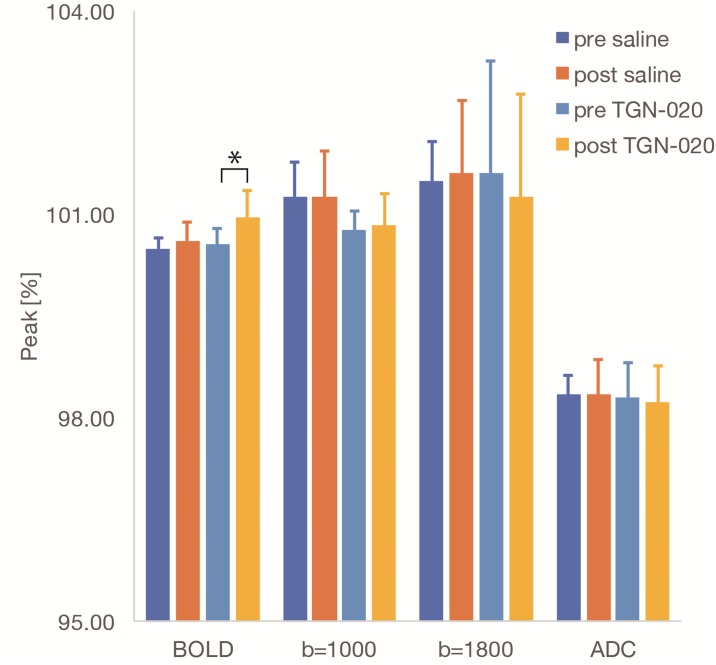
Fig 4. Bar plots for peak amplitude responses—Peak amplitude response before and after TGN-020 or saline administration.
The peak amplitude of the BOLD signal change was significantly higher after TGN-020 administration, no change was observed for the DfMRI signal at b = 1000, b = 1800s/mm2, and for the ADC. The error bars represent the SD between subjects (n = 9). An asterisk indicates a significant difference between pre-administration and TGN-020 administration (p<0.05, paired t-test).

