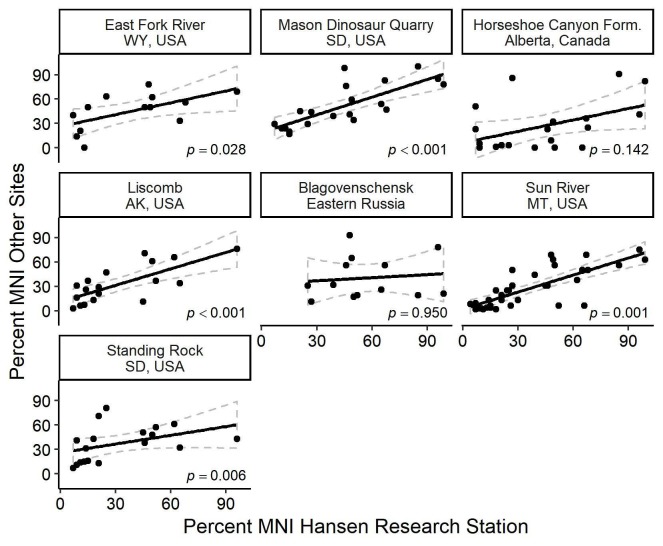
Fig 12. Correlations of percent MNI among published hadrosaurid bonebeds.
The closer the individual dots are to the line, the more significant the correlation is. The gray dotted lines indicate the 95% confidence intervals around each black best-fit line. East Fork River [90], Mason Dinosaur Quarry [10], Liscomb [6], Blagovenschensk [44], Sun River [51], Standing Rock [9].

