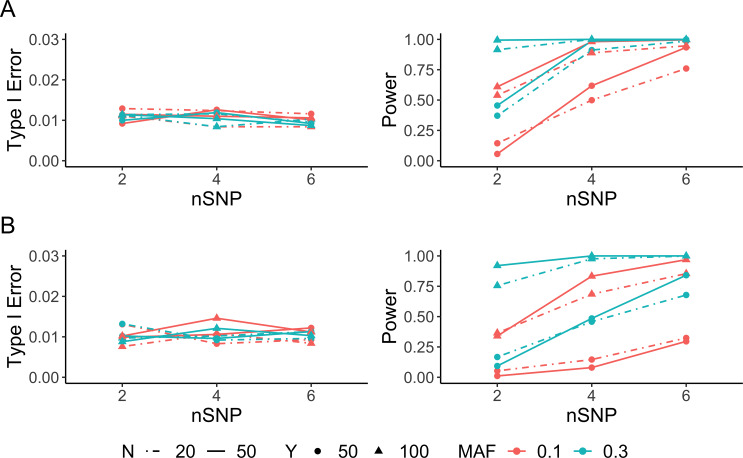
Fig 2. Simulation results for one-condition analysis.
Type I error rate (left) and power (right) evaluated as a function of the number of individuals (N), sequencing depth (Y), number of heterozygous transcribed SNPs (nSNP) and MAF of the cis-regulatory SNP. For each scenario, the type I error rate was examined with 10,000 simulations, and the power with 1,000 simulations at significance level α = 0.01. Performance of ASEP (A) when haplotype phase is known and (B) when haplotype phase is unknown with the population-level ASE equals 0.6 for power evaluation.

