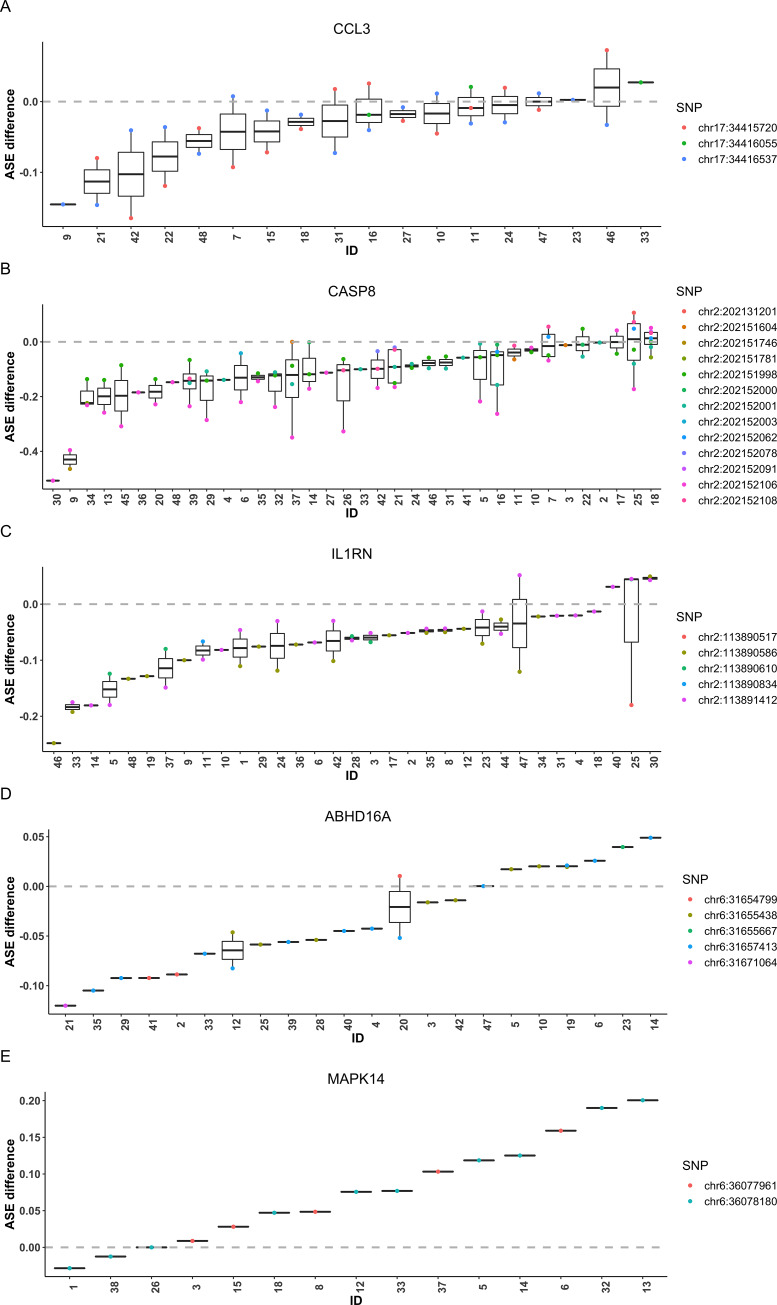
Fig 6. SNP-level ASE difference between M0 and M1 macrophage samples for selected genes showing differential ASE in the macrophage RNA-seq dataset.
We selected five genes, CCL3 (A), CASP8 (B), IL1RN (C), ABHD16A (D) and MAPK14 (E), to show their estimated SNP-level ASE difference for each SNP and individual. The estimated ASE difference was calculated as the difference in the major allele proportion between M1 and M0 samples after haplotype phase alignment. The individuals were sorted by the median ASE difference across all SNPs of each individual.

