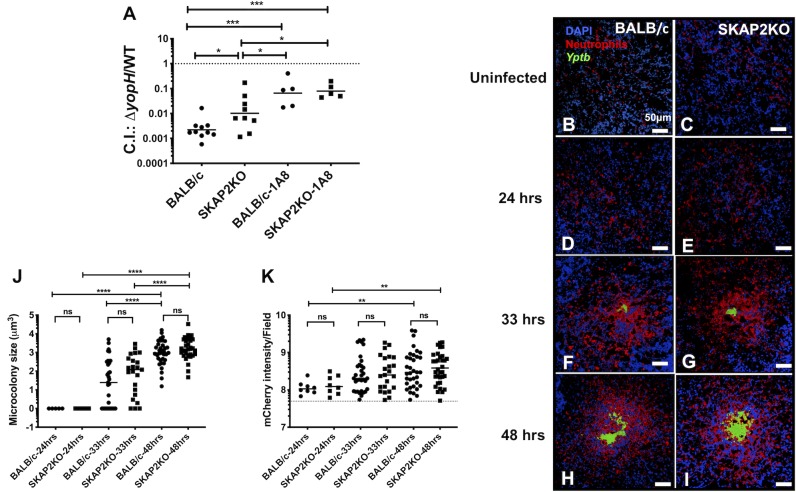
Fig 2. Skap2KO neutrophils cluster to Yptb microcolonies and the growth of a ΔyopH mutant is partially restored in competition with WT-Yptb in Skap2KO mice.
(A) WT-BALB/c and Skap2KO mice were injected with 1A8 or an isotype control antibody and 16 hrs later I.V. infected with an equal mixture of 1x10³ CFU of IP2666 WT-Yptb and ΔyopH-KanR. Spleens were collected three days post-infection, weighed, homogenized, and plated for CFU on selective and non-selective agar. The number of bacteria recovered from selective and non-selective plates was used to determine the C.I. Each dot represents a mouse; horizontal bars represent the geometric mean. Significance was calculated using 2-way ANOVA followed by Tukey’s Post-test of log10 transformed values, with only significant values shown. The results are a composite of three experiments. (B-I) BALB/c and Skap2KO mice were (B-C) uninfected or (D-I) I.V. infected with 103 CFU of IP2666 WT-Yptb-GFP (green), and sacrificed at (D-E) 24, (F-G) 33, or (H-I) 48 hours post-infection. Frozen sections of spleens were stained using an anti-Ly6G antibody (neutrophils-red) and DAPI (nuclei-blue) and visualized by fluorescence confocal microscopy at 40X magnification. (J-K) Using Volocity software, the size of the (J) bacterial microcolony was determined by generating the summed volume of the individual GFP signal and the (K) number of neutrophils recruited was determined by detecting the signal intensity of the mCherry channel. Each dot represents a microcolony or an area of clustered neutrophils. The horizontal solid bars represent the median, and (K) the dotted line represents the median neutrophil signal intensity in uninfected controls of BALB/c and Skap2KO mice. Scale bars: 50 μm. Statistical significance was determined (J-K) using Mann-Whitney for comparing BALB/c and Skap2KO at each time point and Kruskal-Wallis for comparisons between the three time points for each mouse genotype. The results are a composite of 2–3 mice from two independent experiments.

