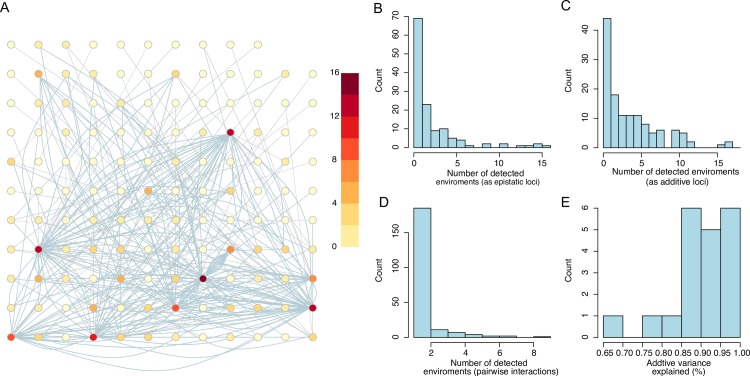
Fig 2. Summary of the features of the complete interaction network for yeast growth across the 20 studied environments.
(A) The complete across-environment interaction network includes 130 loci contributing epistatically to growth in at least one environment. Each node represents a locus, and its colour shows in how many environments it was involved in significant epistatic interactions. The edges represent significant pairwise interactions between loci, with the number of edges connecting pairs of loci corresponding to the number of times this pair was detected across the 20 environments. (B/C) Histograms showing the number of environments in which the 130 loci were involved in at least one significant epistatic interaction/ additive effect. D) Histogram showing the number environments in which each of the 212 pairwise interactions were significant. E) Histogram showing how much of the additive variance for growth in the 20 environments that was explained by the 130 loci in the network.

