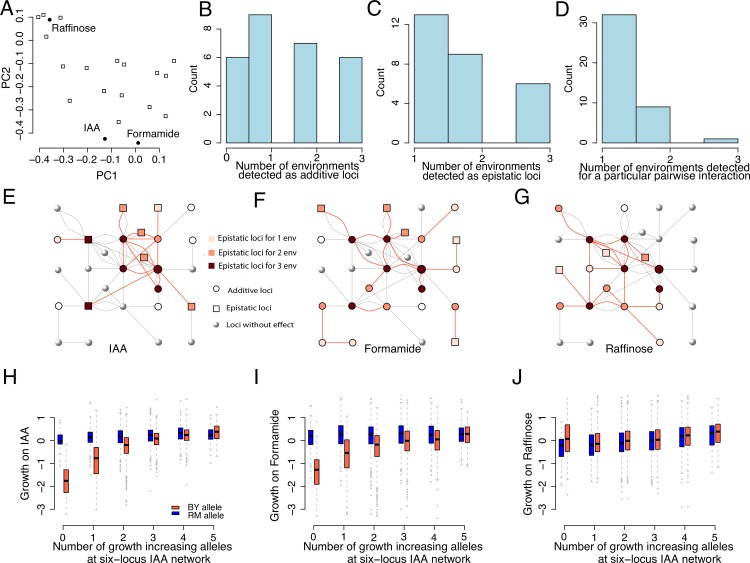
Fig 3. Illustrations of the relationships between environmental perturbations and contributions by high-order interactions contribute to yeast segregant growth.
A) A two-dimensional PCA plot illustrating the resemblance in growths of yeast segregants across the 20 environments (media). Open squares represent a medium and the filled dots media with added IAA or Formamide or the medium where Raffinose was the carbon source. B/C) Histograms showing the number of environments in which the 28 loci had at least one significant epistatic interaction/additive effect. D) Histogram showing the number environments in which each of the 42 pairwise interactions were significant. E-G) Illustrations of differences and similarities in types of genetic effects (epistatic, additive or none) and activity of the interactions in the epistatic growth network on IAA, Formamide and Raffinose, containing media, respectively. The hub and radial loci in the IAA epistatic network studied earlier [31] are highlighted with red/black arrows. The red lines connects significant pairwise interactions reported in Bloom et al [30]. The grey lines indicate epistatic interaction detected in other media. Panes H-J) Each box plot represents a group of segregants with the same number of growth-decreasing alleles at the five radial QTLs, separated and colored based on the genotype at the hub QTL. The x axis gives the number of growth-decreasing alleles at the radial QTLs and the colour of the box indicates the genotype at the hub QTL (chrVIII: 98,622 bp; tomato/ blue corresponds to BY/ RM alleles).

