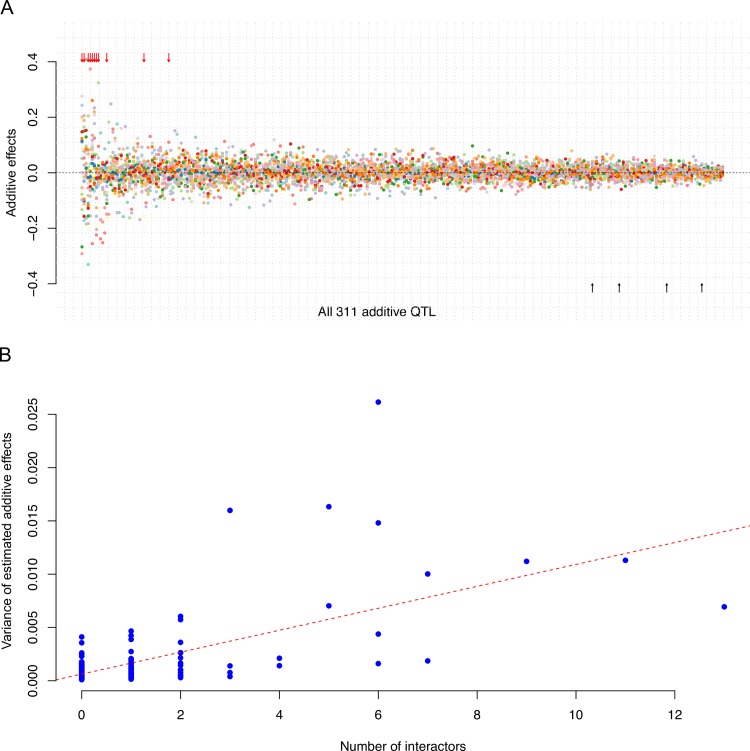
Fig 5. The variations in additive effects on segregant growth and their associations with network activity.
A) 311 loci had significant additive genetic effects on growth in at least one of the 20 environments. The estimated additive effects (y-axis) for each locus (x-axis) in the 20 studied environments are illustrated using dots in different colours. The loci (represented by the most significant SNPs) are sorted from left to right by the variance of the estimated additive effects across the environments. All additive effects estimates were obtained by fitting all 311 loci jointly in a linear model. The 4 loci without significant genotype by environment interactions are indicated with black arrows below the x-axis. Out of the 13 highly activated loci (interacting with more than 4 other loci), 11 had significant additive effects in at least one environment [31] and they are highlighted with red arrows on the top. B) An illustration of the relationship between the maximum number of active epistatic interactions (x-axis) and the variance in their estimated additive effects across the 20 media. Each blue dot represents a locus with a significant additive effect. The red dashed line is the regression line (P value = 7.1 x 10−39).

