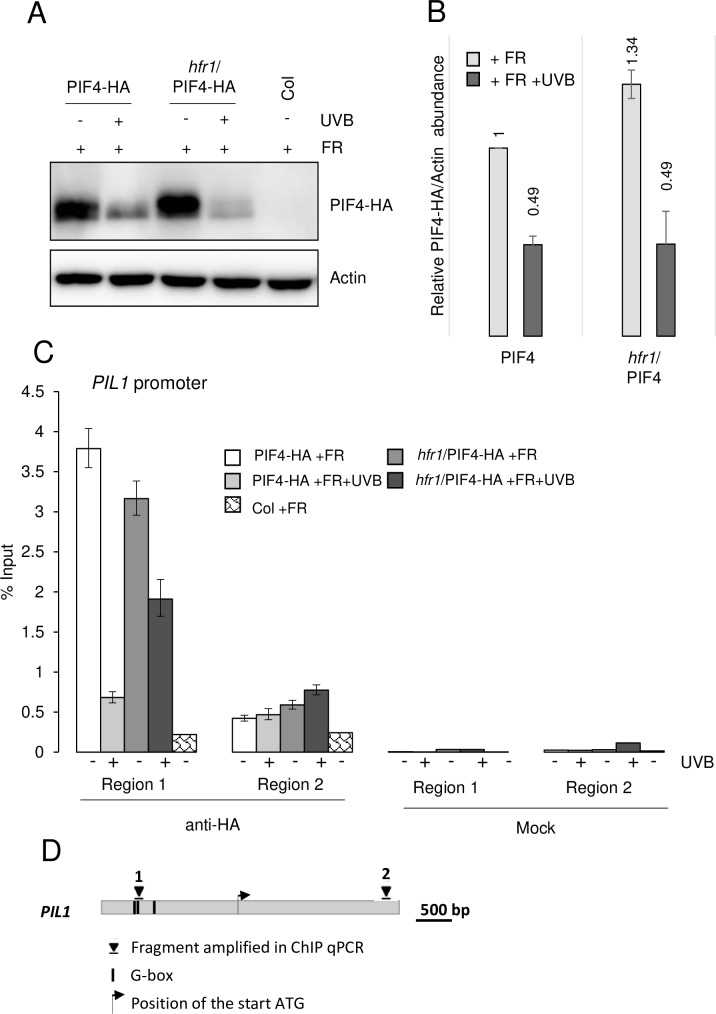
Fig 6. UV-B-induced PIF4 degradation and reduced association with shade marker genes’ promoters is independent of HFR1.
(A) Anti-HA immunoblot analysis of PIF4-HA in 7-day-old seedlings grown in long-day conditions under white light and exposed to 3-h low R:FR (+FR) at ZT3 in the presence (+UVB) or absence of supplemental UV-B (-UVB). Wild type (Col) treated with low R:FR is shown as negative control. PIF4-HA protein levels were analyzed in Col/ProPIF4:PIF4-3xHA (PIF4-HA) and hfr1-101/ProPIF4:PIF4-3xHA (hfr1/PIF4-HA). Blot was re-probed with anti-actin as loading control. (B) Quantification of the immunoblot shown in (A). Error bars represent SD of three biological replicates. (C) Chromatin association of PIF4-HA in 10-day-old Col/ProPIF4:PIF4-3xHA (PIF4-HA) and hfr1-101/ProPIF4:PIF4-3xHA (hfr1/PIF4-HA) seedlings grown in long-day conditions under white light and exposed at ZT3 to 3-h low R:FR with (+) or without (-) supplemental UV-B. Col was included as negative control. ChIP-qPCR was performed for the PIL1 promoter. ChIP of DNA associated with PIF4-HA is presented as the percentage recovered from the total input DNA (% Input). Data shown are representative of two independent biological replicates (see S5E and S5F Fig). Error bars represent SD of three technical replicates. Immunoprecipitated DNA was quantified by qPCR using primers in the promoter region containing a G-box (region 1, ProPIL1_-1417) or control region without a G-box (region 2, ProPIL1_+1816). (D) Schematic representation of PIL1 with G-boxes and regions amplified in ChIP-qPCR indicated.

