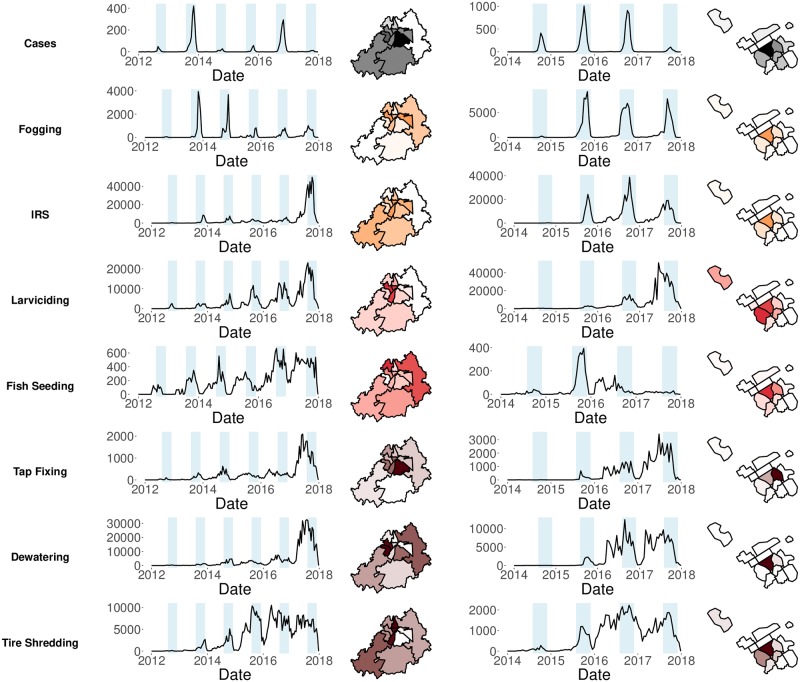
Fig 1. Spatial distribution and timeseries of dengue cases and containment activities.
Spatial distribution and bi-weekly aggregate timeseries of dengue cases and containment activities between 2012 and 2017 in Lahore (left), and between 2014 and 2017 in Rawalpindi (right). Timeseries plots for each city show aggregated numbers from all sub-city spatial units. Spatial units colored to show relative distribution of cases and each containment activity within each city; lighter areas with lower numbers (total number of cases and containment activities summarized in Tables A and B in the appendix). Adulticides are color coded orange, larvicides coded red and source reduction activities coded as brown. Spatial units boundaries for each city are shown as black polygons. In Rawalpindi, spatial units are defined only in areas where cases occurred. All figures produced by the authors.

