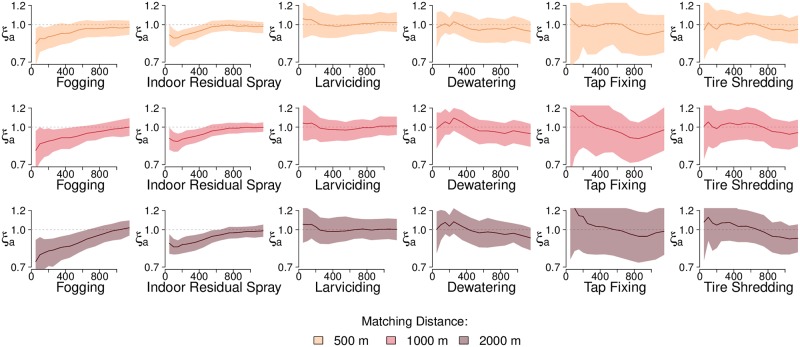
Fig 3. Variation in the effect of containment activity versus the distance (in meters) from index cases.
Variation in the effect of containment activity, ξa(d1, d2), versus the distance (in meters) from index cases using data from Rawalpindi and Lahore across various values of matching distance m. Values of ξa are calculated using containment and non-containment cases which appear in an m = 1000 m radius of each other. The spatial window of the analysis (d2 minus d1) is maintained at 500 m when d2 is greater than 500 m, and observations are made by sliding the window at intervals of 100 m. For d2 less than 500 m, d1 is equal to zero and observations are made by increasing d2 at intervals of 100 m. Spatial dependence estimates are plotted at midpoint of the spatial window. Values below 1 show a lower probability of new cases appearing around a case in proximity of a containment activity, compared to a non-containment case. The time window t2 − t1 is set to 30 days. 95% CI from bootstrapping 100 replications are shown as shaded areas around estimates.

