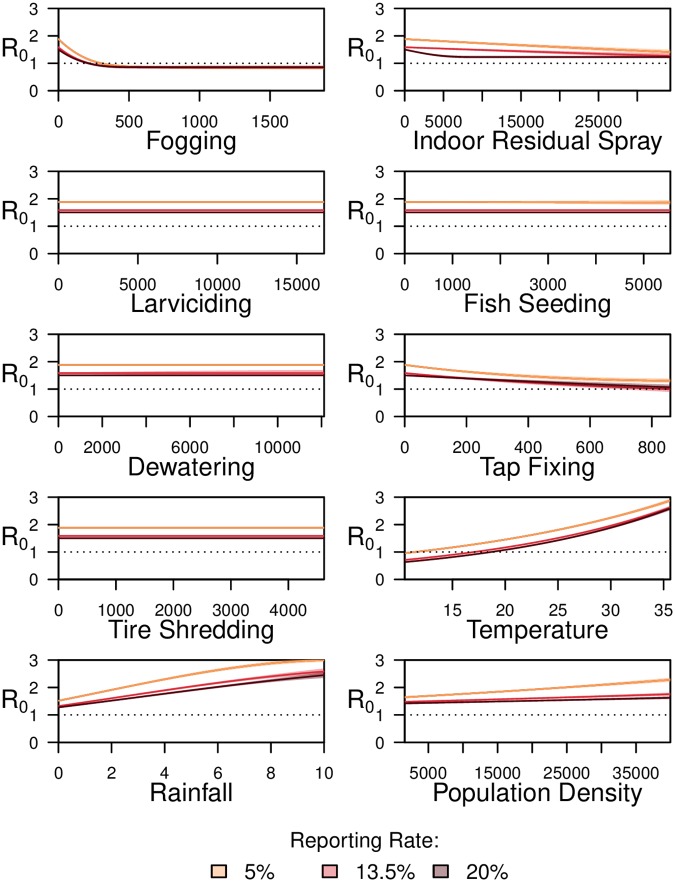
Fig 4. Variation in reproductive number (R0) of dengue, with variation in parameters, in Lahore.
Variation in reproductive number (R0) of dengue, with variation in parameters, in Lahore during 2012–2017 for different incidence reporting rate values. For containment activities, x-axis represents the total number of containment activities performed, in a spatial unit, in a lagged time step and any residue from previous weeks. For temperature, x-axis represents the average temperature in Celsius in a lagged time step. For rainfall, x-axis represents the number of rainfall days in a lagged time step. For population density, x-axis represents individuals per 1 sq.km.

