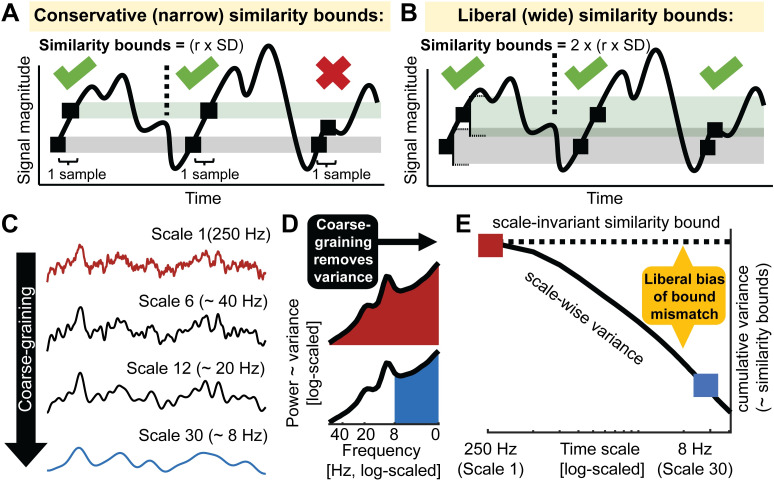
Fig 2. Issue 1: Global similarity bounds systematically confound the entropy of coarse-scale signals with removed spectral power.
(A, B) Similarity bounds constrain sample entropy as shown schematically for entropy estimation using narrower (A) and wider (B) similarity bounds. For clarity, only a subset of pattern matches (green ticks) and mismatches (red cross) are indicated for a sequence length m = 1(cf. Fig 1B). Wider, more liberal similarity bounds indicate more pattern matches than narrow, conservative bounds, thereby decreasing entropy. S2 Fig shows the empirical link between liberal similarity bounds and sample entropy estimates. (C-E) Divergence between global similarity bounds and scale-wise signal SD biases coarse-scale entropy. (C) Coarse-graining (see Fig 1A) progressively reduces variance from the original broadband signal (as shown in panel E). (D) At original sampling rates (i.e., time scale 1; marked red in panels DE and F), neural signal variance is usually composed of broadband 1/f content and narrowband rhythmic peaks. Note that the x-axis plots decreasing frequencies to align with the traditional MSE low-pass filter direction. Towards coarser scales (e.g., scale 30; marked blue in CD and E), signal variance progressively decreases, as the signal becomes more specific to low frequencies. (E) Due to the systematic and cumulative reduction of variance in scale-wise signals, global similarity bounds become liberally biased (‘broad’). Critically, systematic differences in the magnitude of this bias (e.g., due to different spectral slopes) introduce systematic entropy differences at coarser scales.

