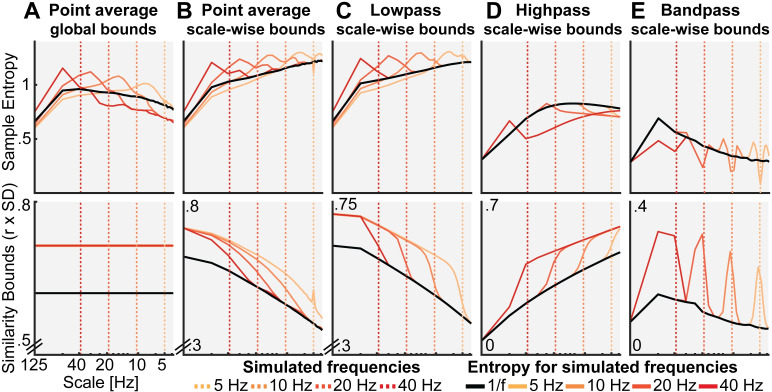
Fig 5. Influence of rhythmic frequency on MSE estimates and similarity bounds across different MSE variants.
Simulations of different frequencies indicate a linear frequency-to-scale mapping of simulated sinusoids. Broken vertical lines indicate the simulated frequency. The original MSE variant (A) shows increased entropy at time scales finer than the simulated frequency in combination with a global entropy decrease. Low-, high- and band-pass variants exhibit the properties observed in the alpha case, with a reduction above (B, C), below (D) or at the simulated frequency (E). Time scales are log-scaled.

