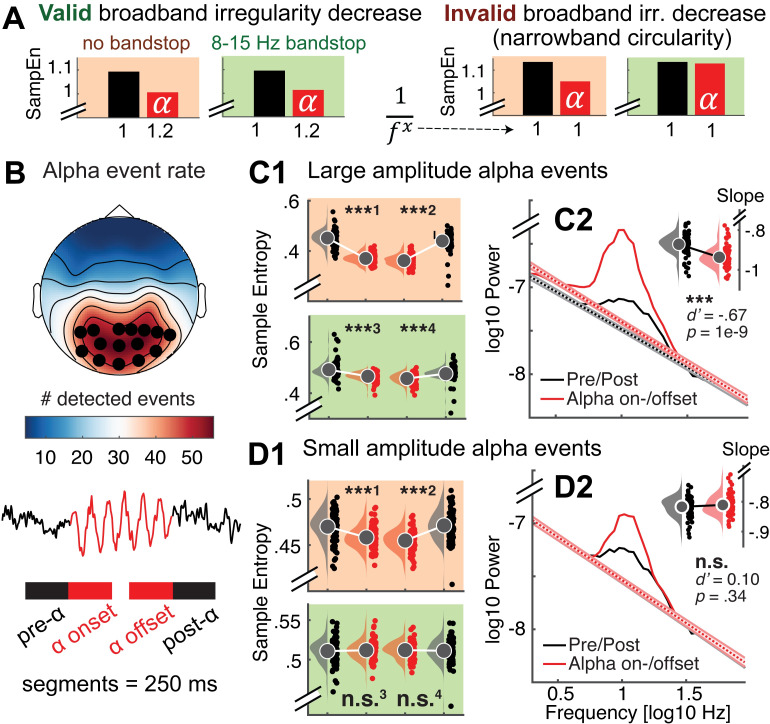
Fig 11. Nonstationary alpha events transiently reduce broadband irregularity.
(A) Testing for transient broadband changes during alpha events requires control for narrowband circularity. We simulated 250 ms signals consisting of varying slope coefficients (plotted on the x-axis) in the presence or absence of alpha rhythms. Bars indicate first-scale entropy estimates (i.e., sample entropy; SampEn) for these signals, as well as bandstop-filtered versions. Left: Valid slope shallowing in the presence of alpha events was indicated both when alpha was included in estimates (red background), as well as when band-stop filters removed the influence of alpha regularity (green background). Right: Crucially, when no bandstop filters were applied, sample entropy decreased also in the absence of slope variations due to the added alpha regularity (red background). This effectively represents narrowband circularity in the analysis. In contrast, bandstop filters removed the influence of alpha regularity and permitted estimation of valid reductions in broadband irregularity (green background). (B, C, D) Empirical analysis of transient entropy decreases during alpha events. (B Alpha events were selected across channels with high amounts of detected events (black dots). Lower: Broadband entropy was calculated for 250 ms segments preceding and following the on- and offset of alpha events. (C1) During eyes open rest, nonstationary alpha events of high strength transiently reduce broadband irregularity, also after accounting for alpha circularity. Raincloud plots (RCPs) indicate the intervals schematically plotted in the bottom panel of B. For visualization, RCPs display estimates that are centered within-subject (condition-wise data minus individual across-condition average plus global average); statistics were calculated on uncentered estimates. ***1: d’ = -1.91; p ~ 0. ***2: d’ = -1.61; p ~ 0. ***3: d’ = -0.63; p = 1e-8. ***4 d’ = -0.54; p = 6e-7 [d' = ()/STD(Xalpha-Xpre/post)]. (C2) Slope fits indicate a shallowing of slopes during alpha events. The inset bar plot indicates mean slopes estimates with within-subject standard errors. (D1) In contrast, irregularity decreases were indicated for low-amplitude alpha events only when circularity was not accounted for, but not after alpha was removed. This indicates that bandstop filtering successfully avoids circularity in empirical use cases. ***1: d’ = -0.52; p = 1e-6. ***2: d’ = -0.75; p = 3e-11. n.s.3: d’ = -0.05; p = 0.63. n.s.4 d’ = -0.04; p = 0.67. (D2) No significant slope changes were observed during low-amplitude alpha events. Note that black dotted line is covered here. Error bars reflect within-subject standard errors.

