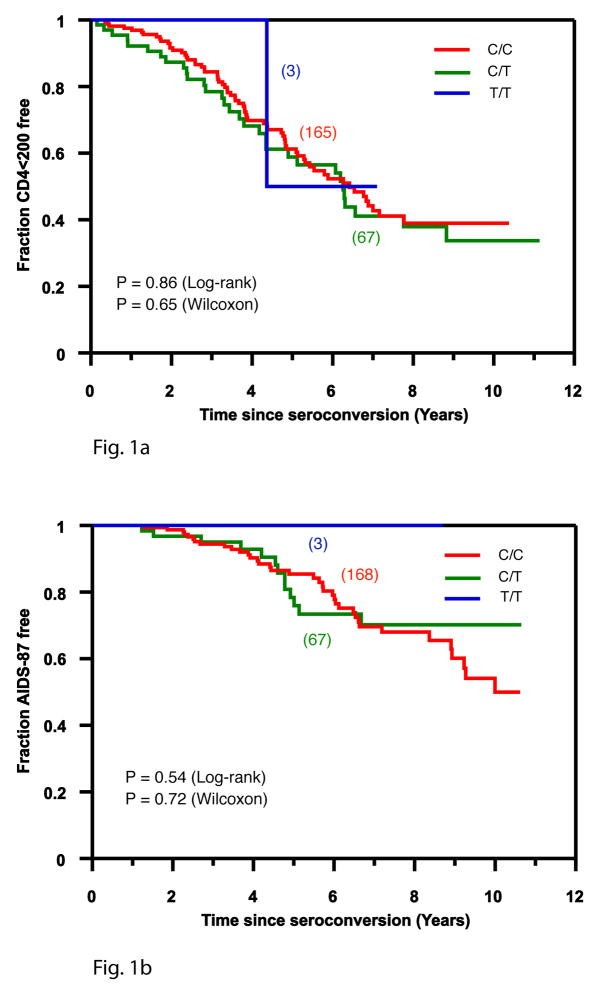
Figure 1.
Kaplan Meier plots showing progression to two AIDS outcomes: < 200 CD4 T cells/μl and clinical AIDS symptoms (AIDS-87) for subjects from the ALIVE cohort, for three DARC -46 genotypes: C/C (DARC null phenotype), red; C/T, green; and T/T, blue. Kaplan-Meier statistics for the log-rank and Wilcoxon test, for a recessive model (DARC -46 CC vs. CT and TT) are shown.

