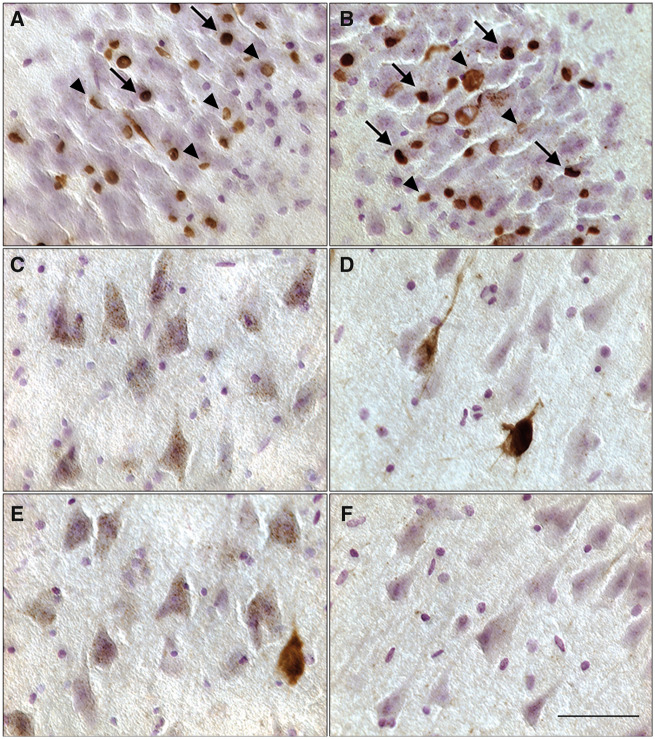
FIGURE 1.
Distribution of mature and preinclusions in the hippocampus. (A, B) Granule cells of the dentate gyrus display high densities of both TDP-43 mature inclusions (arrows) and preinclusions (arrowheads). (C, D) Pyramidal cells in the CA3 field of the hippocampus show high density of preinclusions while demonstrating a near absence of mature inclusions. (E, F) CA1 region displays considerably fewer preinclusions, and in some fields (E), no preinclusions. Mature inclusions were virtually absent from the CA1 field of the hippocampus. Occasionally, sparsely populated preinclusions in the CA fields displayed more intense staining (D, F). Scale bar = 50 μm.

