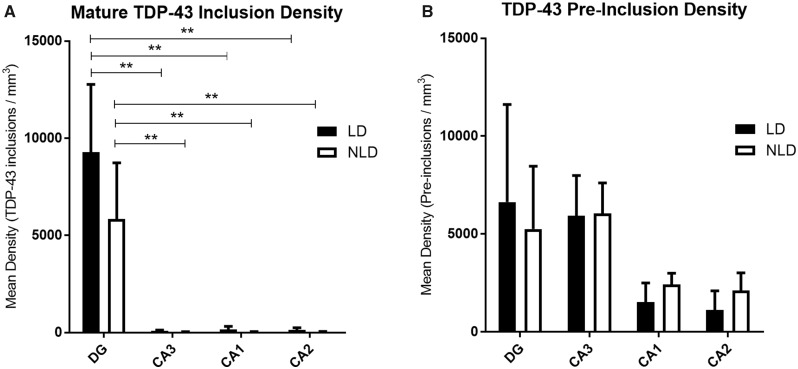
FIGURE 2.
Bar graphs of TDP-43 mature inclusion (A) and preinclusion (B) densities when all cases were combined. Mature inclusions were significantly more abundant in the dentate gyrus than in CA3, CA2, and CA1. Note that there is no significant asymmetry between the language-dominant and nonlanguage-dominant hemispheres for mature or preinclusions within any of the hippocampal subregions. DG, dentate gyrus; CA, Cornu Ammonis; LD, language-dominant hemisphere; NLD, nonlanguage-dominant hemisphere; ** p < 0.05.

